



- Published on: 2026-10-21 10:17:17
How to use Fibonacci retracement to map pullbacks and set profit targets

Fibonacci levels are map points, not automatic trade signals. Using Fibonacci retracement in trading means marking a strong price move and watching for a pullback near common levels such as 23.6%, 38.2%, 50%, 61.8%, and 78.6%. Traders use these areas to assess potential support or resistance, then look for other evidence before acting.
It’s easy to see why the method appeals: a chart turns one sharp move into clear zones to monitor. But a level can fail, and drawing it across the wrong swing can make the setup misleading. Precision starts with choosing the right move, not trusting every line.
This guide shows you how to draw retracements in an uptrend or downtrend, assess pullbacks without treating a level as a promise, and use Fibonacci extensions to plan potential profit targets. You’ll also learn how common mistakes distort analysis and how to combine the tool with trend context and risk management. Use the levels to guide decisions, not replace them.
Key Takeaways
- Anchor retracement levels to a clear swing: use the low-to-high move in an uptrend and the high-to-low move in a downtrend.
- Read common retracement percentages as potential support or resistance areas, then look for price behavior that supports your trade idea.
- Use Fibonacci extensions to map possible profit-taking zones beyond the original move, and choose targets in line with your plan.
- Avoid forcing the tool onto unclear swings or treating a level as a signal; combine it with trend context and risk management.
- Match your trading environment to your approach, with TradingPRO’s Rookie Account as an option to explore as you build your process.
How do Fibonacci retracements work?
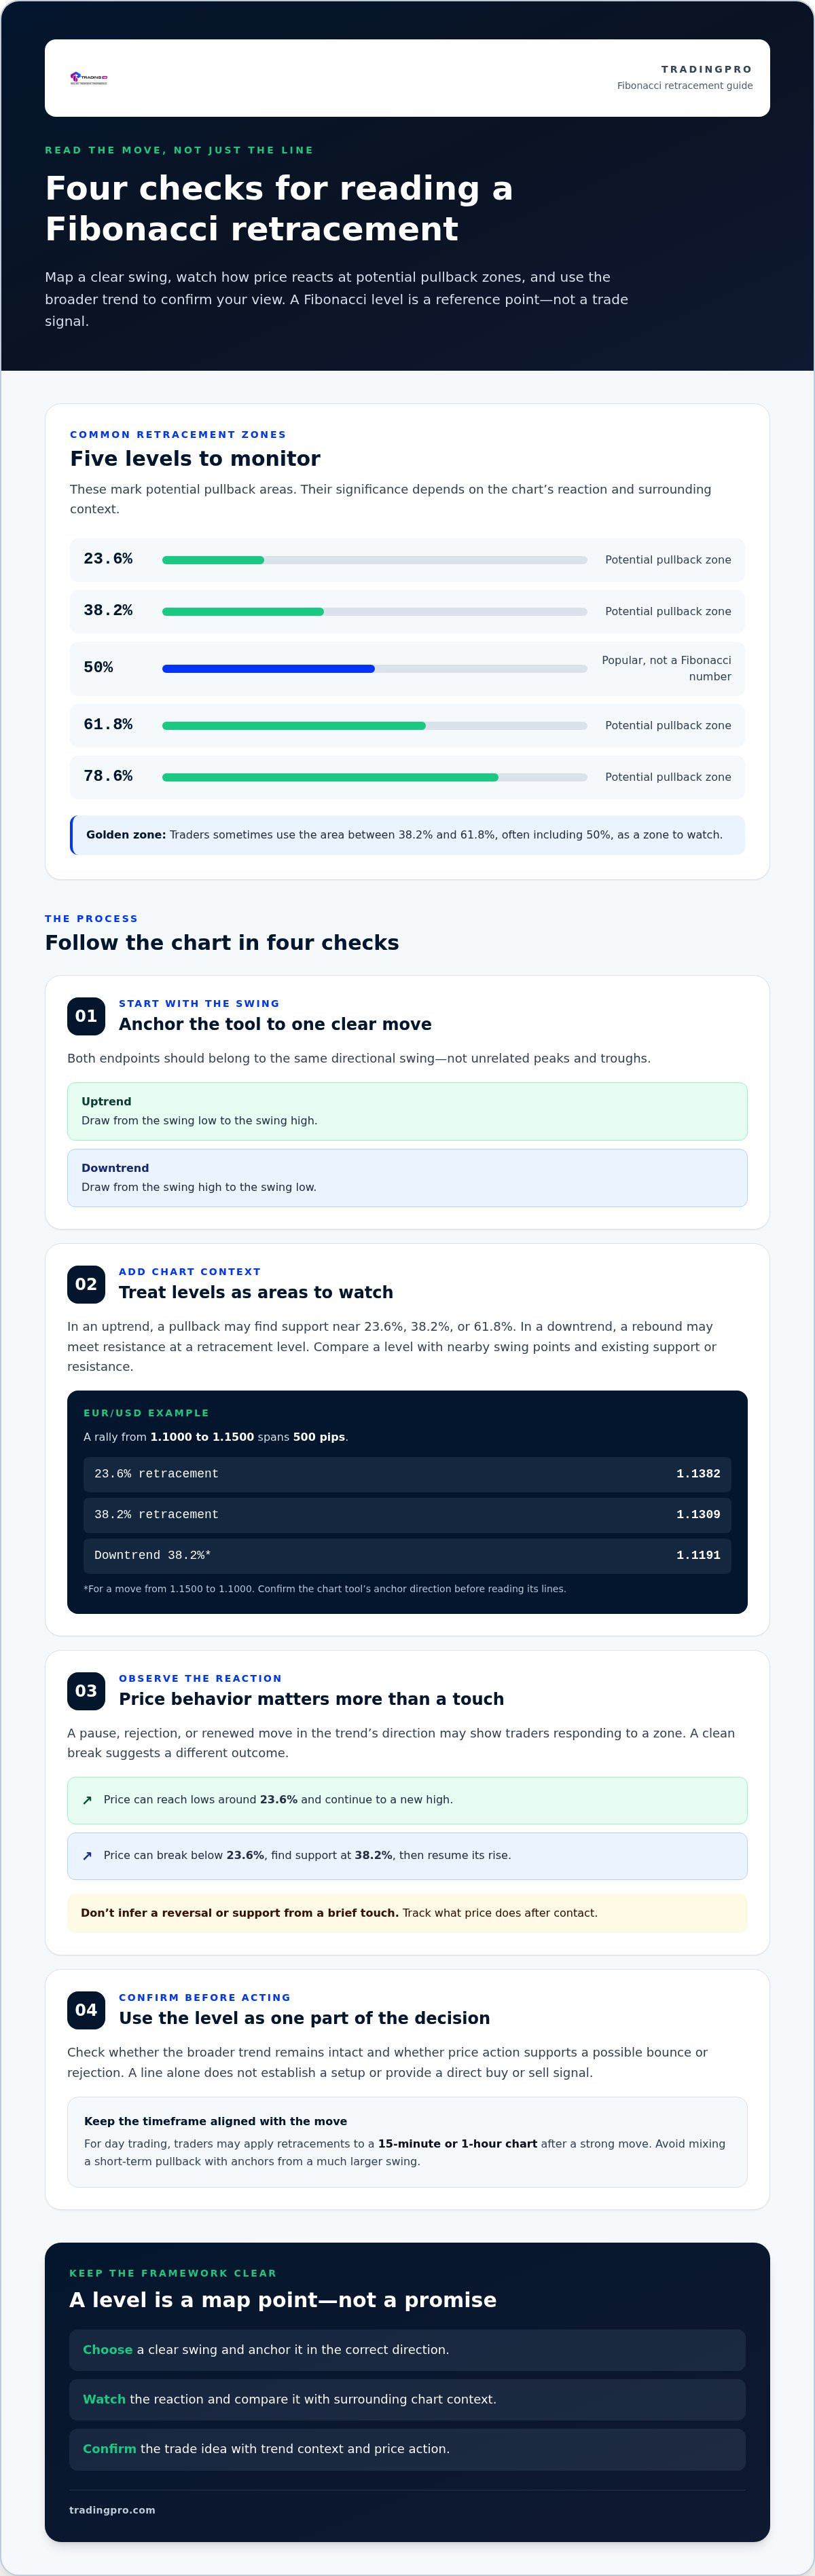
Fibonacci retracement levels divide a selected price swing into potential pullback zones, including 23.6%, 38.2%, 50%, 61.8%, and 78.6%. The drawing rule is consistent across stocks, forex, crypto, and other markets, while price behavior can vary by asset and timeframe.
Use the levels to organize your chart, then assess each zone against the trend and price action. Follow these steps to map a move and judge what happens next.
-
Draw Levels Across a Trend
Choose a clear swing and anchor the tool at its endpoints. In an uptrend, draw from the swing low to the swing high; in a downtrend, draw from the high to the low. The chart then plots retracement levels across that move. Make sure both anchors belong to the same directional swing, not unrelated peaks and troughs.
For example, a EUR/USD rally from 1.1000 to 1.1500 spans 500 pips. Its 23.6% retracement is 1.1382, and its 38.2% retracement is 1.1309. In a downtrend from 1.1500 to 1.1000, the 38.2% retracement is 1.1191. Confirm the chart tool’s anchor direction before reading its lines.
-
Identify Potential Support or Resistance
Mark the retracement levels as areas to watch, not fixed barriers. During an uptrend, a pullback may find support near 23.6%, 38.2%, or 61.8%; in a downtrend, a rebound may meet resistance at a retracement level. These zones help frame support and resistance, but the chart’s reaction determines whether a level matters.
Compare a line with nearby swing points and existing resistance levels. If a former price floor overlaps a 38.2% retracement, that area provides more context than an isolated line. Traders sometimes call the area between 38.2% and 61.8%, often including 50%, the golden zone. Remember, 50% is popular but isn’t technically a Fibonacci number.
-
Check Price Reactions at Levels
Watch how price behaves as it reaches a retracement level. A pause, rejection, or renewed move in the trend’s direction may indicate that traders are responding to the zone. A clean break through it suggests a different outcome. Don’t treat a brief touch as proof of support, resistance, or a reversal.
One price example shows an uptrend reaching lows around 23.6% before continuing to a new high. Another shows price breaking below 23.6%, finding support at 38.2%, then resuming its rise. These contrasting reactions demonstrate why levels are reference points. Track what price does after contact, not just which line it touches.
-
Use Levels as Confirmation
Wait for the chart to support your trade idea before acting on a retracement level. Check whether the broader trend remains intact and price action confirms a possible bounce or rejection. Fibonacci retracement levels estimate potential support and resistance; they aren’t direct buy or sell signals. A line alone doesn’t establish a setup.
The same approach can be applied across asset classes, but swings and reactions differ. For day trading, traders may apply retracements to a 15-minute or 1-hour chart after a strong move. Choose a timeframe that matches the move you’re analyzing, and avoid mixing a short-term pullback with anchors from a much larger swing. Use the level as one part of your decision.
Fibonacci extensions for profit targets
A retracement maps how far price pulls back within a move; an extension projects potential levels beyond it. Traders use extensions to plan profit-taking zones if the trend resumes, not to predict exactly where price will stop.
- Set the three chart anchors. In an uptrend, mark the swing low, swing high, and end of the pullback; in a downtrend, reverse the direction. The extension tool uses these points to project levels beyond the initial move. Make sure the pullback belongs to the swing you’re measuring, or the projected targets may not fit your setup.
- Choose extension levels as planning zones. Common projections include 127.2%, 150%, 161.8%, and 261.8%. The 161.8% extension is a widely used profit-target level, while 261.8% may help map a more extended move. Treat each as a place to review the trade, not a promise that price will reach it.
For example, an NVIDIA trade example identifies $151.70 as the 127.2% extension target. That figure belongs to the example’s chart setup. On another chart, the projected price depends on the swing anchors and the extension level selected.
- Define the entry trigger before placing an order. Touching an extension isn’t an entry signal, since extensions primarily project targets. For a trending setup, traders can wait for a pullback, then use price action at a retracement zone to define a possible entry. Write down the condition that activates the trade, such as a confirmed move back in the trend’s direction.
Next, place the stop where the trade idea is invalidated, rather than choosing a distance to fit a desired target. In the NVIDIA example, the suggested stop was $90.65, the swing low. The example used a one-hour chart and reported a 2.16 risk-reward ratio. Those details illustrate a plan, not a template for other charts.
- Plan how to manage the position as price approaches each projection. At 127.2% or 161.8%, a trader might take profit or reassess whether the trend remains strong. The 150% and 261.8% levels offer further reference points for subsequent moves. Decide your response before entry, so a fast price move doesn’t replace your strategy with an impulse.
Keep the initial risk, entry trigger, and target in one written plan. To put a defined trading plan into practice, open a trading account and apply the same criteria consistently.
What is the Fibonacci Golden Ratio?
Trace the Fibonacci sequence to understand why trading charts display ratios such as 61.8% and 38.2%. The sequence explains the mathematics behind these levels, while price action determines how traders use them.
-
Review the Fibonacci Sequence
Start with the sequence 0, 1, 1, 2, 3, 5, and 8. Each number after the first two equals the sum of the two numbers before it: 3 follows 1 and 2, while 8 follows 3 and 5. Continue the pattern to see how ratios between sequence values create the familiar Fibonacci relationships.
The sequence dates back to the 12th century. For chart analysis, focus on how its ratios inform levels, not on treating the sequence itself as a price indicator. A pullback on a chart doesn’t follow the sequence mechanically; traders apply its ratios to measure a swing.
-
Connect the Sequence to the Golden Ratio
Compare successive Fibonacci numbers as the sequence grows. Their ratio approaches 1.618, known as the golden ratio. Its inverse is 0.618, or 61.8%, a widely watched retracement level. For example, 89 divided by 144 is approximately 0.618, while 610 divided by 377 is approximately 1.618.
Other common chart ratios also come from sequence relationships: 13 divided by 34 is approximately 0.382, or 38.2%; 13 divided by 55 is approximately 0.236, or 23.6%. These calculations explain the mathematical basis of several retracement levels. They don’t establish that price must react at any one of them.
- Separate the mathematical ratio from the trading decision. The 61.8% retracement comes from the inverse golden ratio, but it’s a potential decision area, not an instruction to buy or sell. In an uptrend, a pullback toward that area may prompt traders to assess whether upward momentum remains. In a downtrend, a rebound toward it may be watched as a possible resistance area.
Use price action to decide what the level means. If price pauses at 61.8% and then moves with the trend, that reaction can support a trade idea. If it pushes through the level, the original interpretation may need revisiting. The ratio marks a chart location; it doesn’t confirm a reversal on its own.
- Keep Fibonacci ratios in context with other indicators and the chart’s structure. A 38.2% level overlapping a previous swing area gives traders more context than the ratio alone. Likewise, a 61.8% level can help frame a pullback, while a separate extension analysis may help plan targets after a move resumes.
Make the sequence useful, not mystical. Treat 23.6%, 38.2%, and 61.8% as measurement references, then base action on the direction of the trend and the market’s response. That discipline keeps the golden ratio connected to chart evidence rather than turning a mathematical relationship into a standalone strategy.
Advantages and limitations of Fibonacci retracement
Use Fibonacci levels to structure chart analysis, not replace it. A clear process helps reveal both the tool’s value and its limits.
-
Consider the Advantages
Start by using retracement levels to map possible pullback areas after a defined price move. Levels such as 23.6%, 38.2%, and 61.8% give traders shared reference points for reviewing a chart. In an uptrend, these markers can help organize where to watch for a bounce, rather than chasing price after a sharp advance.
Fibonacci analysis also gives a repeatable way to compare swings. Apply the same drawing rule to a clear move, then record whether price pauses, turns, or breaks through a level. This can make chart reviews more consistent across stocks, forex, indices, and commodities. The golden ratio’s inverse, 0.618, underpins the 61.8% level, linking the chart tool to a defined mathematical relationship.
Use that structure to build a trade plan. For example, if an uptrend pulls back toward 38.2%, check trend direction and price action before deciding whether the area supports your setup. A level can help frame an entry area, define where the idea no longer holds, and compare potential targets. The benefit is a clearer analysis process, not a prediction of the next price move.
-
Recognize the Limitations
Check each Fibonacci reading against the chart’s structure. Retracements don’t always work, and a level alone doesn’t confirm a reversal or continuation. Two traders may select different swing highs or lows and get different lines. If the anchors don’t represent the same clear price move, the resulting levels can mislead your analysis.
Check for evidence beyond the ratio. A 61.8% level without a supporting trend, price reaction, or nearby chart structure is only a reference. If price moves decisively through the area, don’t treat the line as guaranteed support or resistance. Indicators can add context, but they also shouldn’t be used as automatic confirmation when their signals conflict with price action.
Manage risk before entering. Choose a stop loss based on where the trade idea is invalidated, rather than assuming a Fibonacci level will hold. Use position sizing and a planned exit to limit the impact of an unsuccessful setup. Fibonacci levels estimate potential support and resistance; they are not direct buy or sell signals.
Review the results using your own chart examples. Record the swing you selected, the level you watched, your reason for entering, and what price did next. This helps show whether your use of Fibonacci fits your strategy and timeframe. Keep the tool when it adds clarity; set it aside when unclear anchors or conflicting price action make the reading unreliable.
Common Fibonacci trading mistakes
Fibonacci levels can sharpen chart analysis, but small drawing errors can distort a setup. Use these checks to avoid treating retracement lines as automatic signals.
- Choose a meaningful swing. Anchor the tool to a clear price move, not a pair of convenient points. On an uptrend chart, connect the swing low and high; don’t use a minor candle high from inside the move. If the anchors shift, levels such as 38.2% and 61.8% shift too, changing the analysis.
- Match the anchors to the timeframe. A short-term pullback shouldn’t be measured against unrelated points from a much larger move. For example, after a strong move on a 15-minute chart, select the visible swing relevant to that chart. Keep the direction consistent, then reassess the drawing when price forms a new, distinct swing.
- Don’t treat a line as a signal. A price touch at 61.8% doesn’t prove support, resistance, or a reversal. Look at the next price action instead. For example, a candlestick that reaches a retracement level and closes beyond it gives a different picture from price rejecting the zone and moving with the trend.
- Avoid forcing a bounce. Price may pass through 23.6% or 38.2% without pausing. Don’t keep interpreting each break as confirmation of your original idea. If an uptrend loses structure while price moves through successive levels, reassess the trend direction rather than assuming the next Fibonacci point must hold.
- Don’t crowd charts with competing drawings. Several overlapping retracement sets can make nearly every price point look meaningful. Keep the clearest swing visible and remove lines from old moves that no longer guide the current setup. For instance, if two sets place different 61.8% levels near price, decide which swing matches your analysis before interpreting either one.
- Plan risk before entry. A retracement level doesn’t define how much a trade can lose. Set an invalidation point based on the trade idea, then size the position around that risk. Don’t move a stop simply because price approaches 50% or 61.8%; those lines estimate potential zones, not guaranteed turning points.
- Review the whole setup, not one indicator. Compare the Fibonacci reading with the trend, chart structure, and your entry rule. Record the selected swing, the level watched, and the price response after each trade. This makes repeated errors easier to spot. Put your charting process into practice with a clear plan for each setup.
TradingPRO: Rookie Account
TradingPRO’s Rookie Account gives traders an account option to consider as they put chart analysis into practice. If you’re refining how you select swing points, assess pullbacks, and plan exits, focus on building a consistent process before adjusting your approach. The Rookie Account is one of TradingPRO’s account options; the Micro Account, Pro Account, and Scalp Account are also available for different trading approaches.
Keep your Fibonacci levels, entry criteria, and risk plan connected. The method helps map potential zones, while your decisions still depend on the chart and your trading rules. Explore the Rookie Account on TradingPRO’s website to see whether it fits your next step.
Turn Your Chart Reading Into a Clearer Process
Make your chart decisions repeatable. Before each trade, write down what would support your idea, what would invalidate it, and how you’ll respond if price behaves differently. This turns using Fibonacci retracement in trading from a chart exercise into a deliberate routine you can review and refine.
Choose an account option that aligns with your current approach. TradingPRO offers Rookie, Micro, Pro, and Scalp Accounts for different trading styles and needs. Focus on applying a consistent process rather than expecting an account or chart tool to determine your results.
Ready to take your next step? Explore TradingPRO account options and build your trading routine with purpose.
Frequently Asked Questions
What is Fibonacci in Trading?
Fibonacci in trading means using mathematical ratios to mark potential areas of interest on a price chart. Traders apply ratios derived from the Fibonacci sequence to swings in stocks, forex, indices, and commodities. The resulting lines help frame possible pullbacks, support, resistance, or future targets. They’re a charting aid, not a forecasting method that tells traders exactly what price will do next.
What is the Fibonacci sequence?
The Fibonacci sequence is a number pattern in which each value is the sum of the two before it, beginning 0, 1, 1, 2, 3, 5, and 8. Ratios between its values approach the golden ratio, 1.618, as the sequence grows. In trading, ratios derived from this pattern inform chart levels. Traders use the resulting levels as references, rather than expecting market prices to follow the sequence itself.
What is Fibonacci retracement in trading, and how does it work?
Fibonacci retracement is a chart tool for measuring how much of a price swing is given back during a pullback. After selecting a clear swing, the tool plots ratios across that move. Traders then watch how price behaves around those levels. A line can help organize a trade idea, but it doesn’t independently confirm an entry or show that a trend will continue.
How are Fibonacci retracement levels calculated and drawn on a chart?
Most charting platforms calculate and plot the levels after you select the swing’s endpoints. To calculate manually, find the difference between the swing high and low, multiply that range by a retracement ratio, then subtract the result from the high for an upward move. For a downward move, measure the corresponding pullback upward from the low. Confirm that the tool’s anchor direction matches the swing.
What are the key Fibonacci retracement levels, such as 38.2%, 50%, and 61.8%?
Common chart levels are 23.6%, 38.2%, 50%, 61.8%, and 78.6%. Traders often pay attention to 38.2% and 61.8% because they’re derived from Fibonacci relationships. The 50% level is popular, but it isn’t technically a Fibonacci ratio. A platform may display 76.4% instead of 78.6%, so identify which line your chart uses before interpreting it.
How do traders choose swing highs and swing lows for Fibonacci retracement?
Choose visible turning points that define one clear directional move. In an uptrend, use the low where the advance began and the high where it paused; in a downtrend, use the high and subsequent low. Don’t select a small fluctuation inside a larger swing just because its levels align with your preferred trade. If the chart forms a significant new turning point, reassess whether the original anchors still describe the active move.
How can Fibonacci retracement levels be used to identify entry points and price targets?
Use a retracement area to focus your entry analysis, then wait for price behavior that fits your trade plan. For example, a trader could look for a pullback to meet a preselected level before assessing whether the trend resumes. A retracement level alone isn’t an entry trigger. For potential targets beyond the original swing, traders may use extensions such as 127.2% or 161.8%, while setting risk independently.
How should Fibonacci retracement be combined with support and resistance, trendlines, or indicators?
Compare a Fibonacci level with existing chart evidence rather than treating each tool as a separate command. For example, if a retracement overlaps a previous price floor or an upward trendline, watch for a clear response near that shared area. Indicators can provide additional context, but conflicting signals call for reassessment, not selective interpretation. This makes using Fibonacci retracement in trading part of a broader analysis, not a standalone strategy.


