




- Published on: 2026-10-18 10:14:41
Learning Price Action from Scratch: A Practical 2026 Guide
What if the fastest way to read a price chart is to stop searching for a perfect pattern? Candlesticks, trend structure, and support or resistance can seem like separate topics, especially when strategies online appear to contradict one another. Learning price action from scratch means bringing those pieces together and describing what price is doing before treating any pattern as a signal.
This guide shows you how to read basic chart information, describe market movement clearly, and build a repeatable analysis routine. You’ll learn how candle data, swing highs and lows, trends, and key price areas fit together, then use that context to assess a possible setup instead of relying on a familiar-looking shape alone.
Start with observation, move to structured practice, and keep risk controls central before making decisions in live markets. The goal isn’t to predict every move. It’s to develop a consistent process for reading charts, testing ideas, and deciding when the evidence isn’t clear enough to act.
Key Takeaways
- Read candles as records of price movement, then zoom out to identify the broader market structure.
- Use swing highs and lows to describe trends, while remembering that patterns can have more than one interpretation.
- When learning price action from scratch, build skill through focused chart observations instead of collecting signals.
- Practise with one market, timeframe, and concept. Annotate charts before checking what happened next.
- Include context, planned risk, and review in your process. No pattern can guarantee what price will do.
What Is Price Action? Start with What the Chart Actually Shows
A chart can feel abstract at first. Candles, lines, and changing prices seem to demand a whole new language. Begin with what’s visible: price action is the movement of an asset’s price over time, displayed on a chart. Each mark records past activity over a selected interval, giving you something concrete to observe before interpreting it.
Price action analysis focuses on that movement, including how prices change, pause, and form highs and lows. It doesn’t require you to ignore every other tool. A chart can include indicators or other information, but price remains the central evidence in price action analysis. For a broader overview, see What is Price Action Trading?
Price action is recorded price movement; a trading interpretation is a conclusion drawn from that record. Keep the two separate. Noticing a candle close above an earlier high is an observation. Deciding that price will continue rising is a forecast, and forecasts can be wrong.
What information does a candlestick contain?
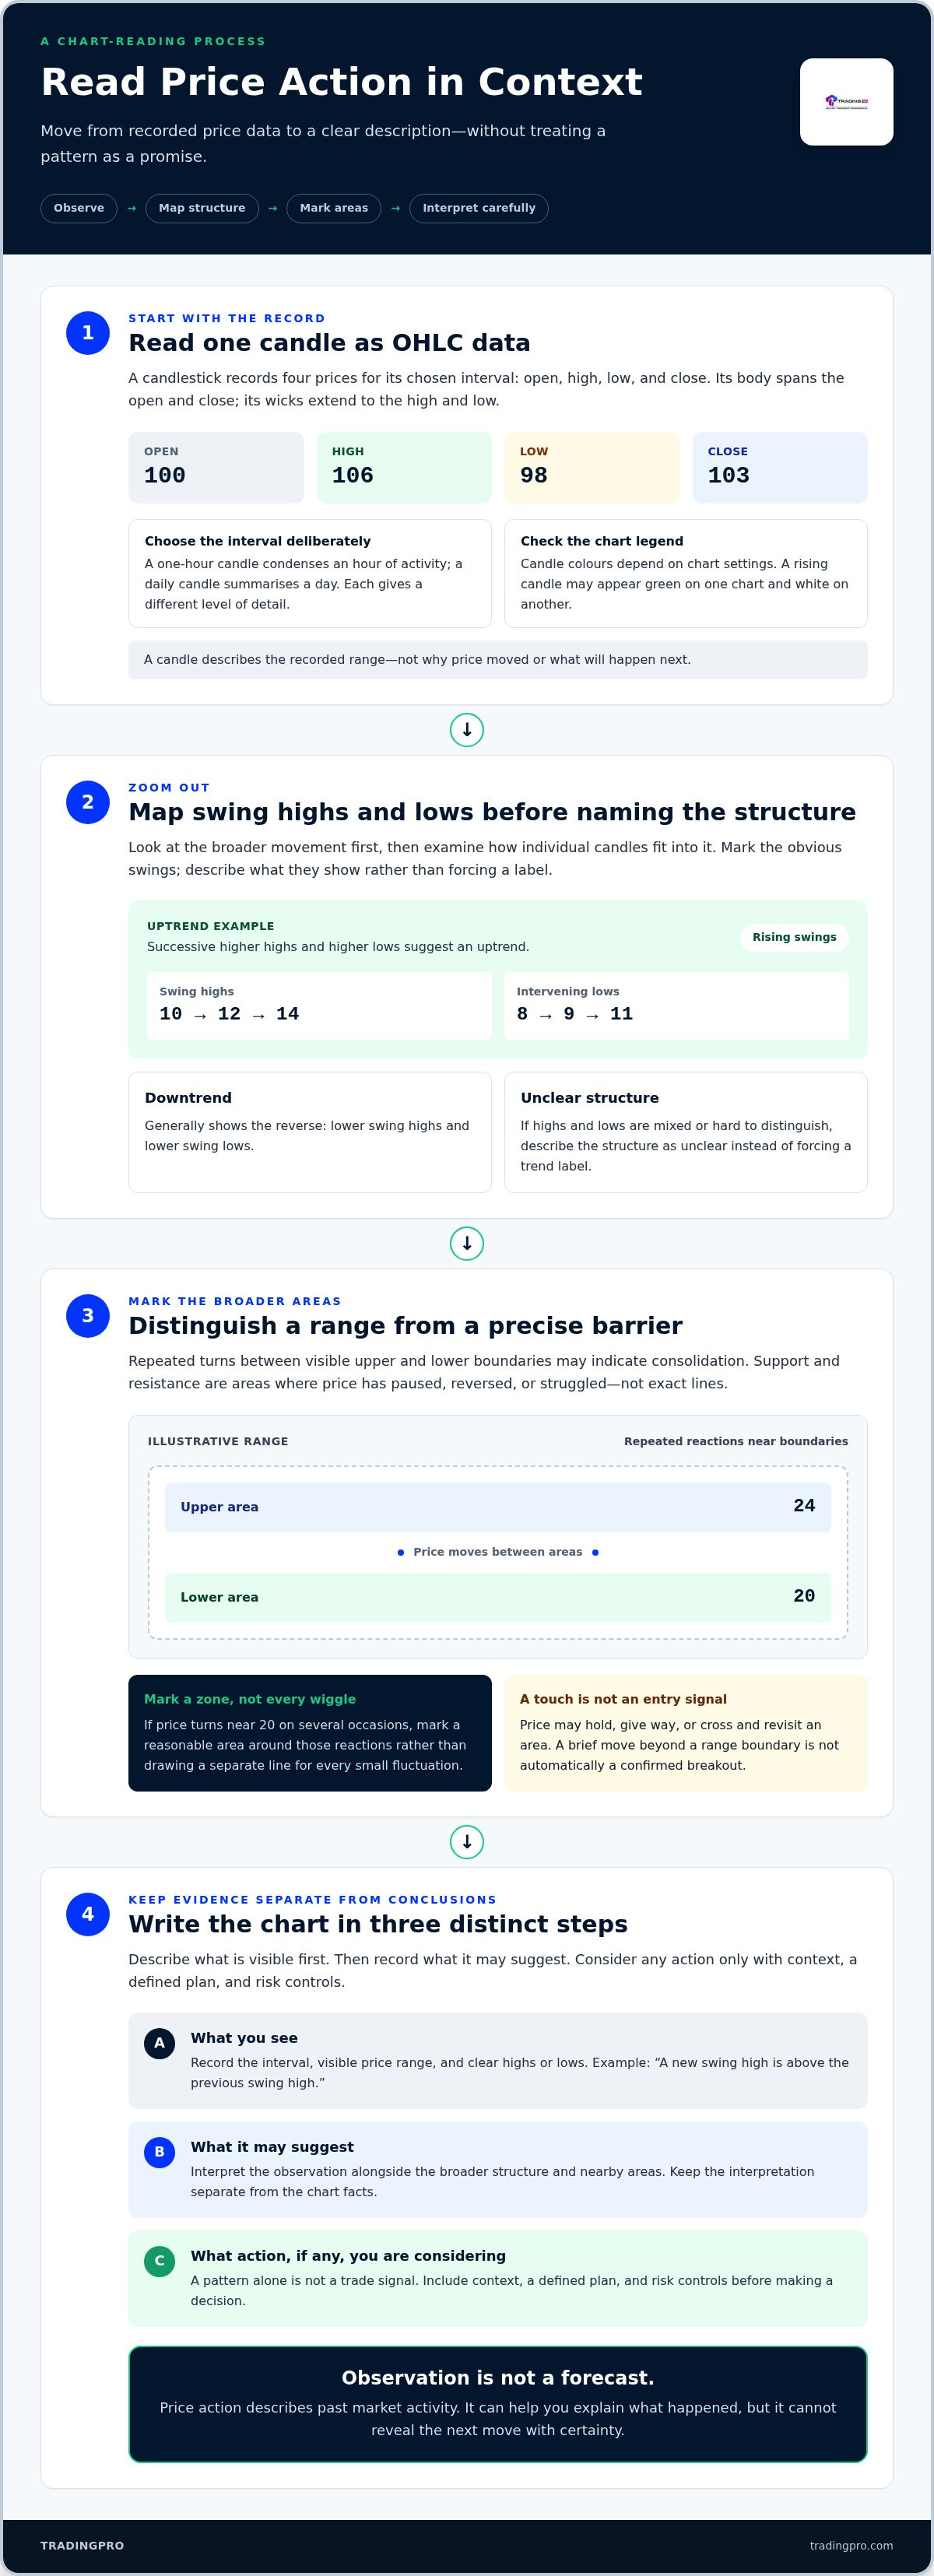
A candlestick summarises four prices for its chosen interval: open, high, low, and close, often shortened to OHLC. Imagine a hypothetical candle that opens at 100, reaches a high of 106, falls to a low of 98, and closes at 103. Its body spans the open and close; its wicks extend to the high and low.
The interval matters. A one-hour candle condenses price activity over an hour, while a daily candle summarises a day. Each provides a different level of detail, not a different promise about what comes next. Candle colours also depend on chart settings. One chart may show a rising candle in green, another in white. Check the chart legend instead of assuming.
The body and wicks describe the recorded range. They don’t, by themselves, prove why price moved or reveal the intentions of buyers and sellers. A long wick means price reached farther from the body during that interval, then closed elsewhere. Record it as one detail to interpret alongside the rest of the chart, not as a complete explanation.
What price action can, and cannot, tell a beginner
A chart shows past market activity. It can help you describe what has happened, but it can’t reveal the next move with certainty. For example, if a new swing high rises above the previous swing high, you can record a higher high. That’s an observation, not proof that the next high will be higher too.
Separate your process into three steps: what you see, what you think it may suggest, and what action, if any, you’re considering. A price pattern alone isn’t a trade signal. Context, a defined plan, and risk controls matter before any decision. Uncertainty is part of market analysis, so avoid treating a chart reading as a certainty or rushing into a position to resolve doubt.
When learning price action from scratch, practise describing a chart in plain language before predicting anything. Write down the interval, the visible price range, and any clear highs or lows. Then record your interpretation separately. This makes it easier to spot when an assumption has slipped into what you thought was an objective reading.
How to Read Candles, Trends, and Market Structure
Before studying individual candles, zoom out. The larger structure helps you see whether price is generally advancing, declining, or moving sideways. Then zoom in to examine how each candle fits that picture. One candle is a detail; its context helps you interpret that detail.
Keep the chart simple enough to read, but don’t assume that an indicator-free chart is the only valid way to analyse price. Some traders use indicators alongside price structure. When learning price action from scratch, first practise describing the swings you can see. Add other tools only if they help answer a specific question.
How can beginners identify a trend or range?
Mark the obvious swing highs and lows before naming a trend. In a hypothetical sequence, price makes highs at 10, 12, and 14, while the intervening lows rise from 8 to 9 to 11. Those successive higher highs and higher lows suggest an uptrend. A downtrend generally shows the reverse: lower swing highs and lower swing lows.
These are useful descriptions, not rigid laws. Swings can overlap, reverse, or be difficult to distinguish, especially when you change the chart interval. If the highs and lows are mixed, describe the structure as unclear rather than forcing a trend label.
When price repeatedly moves between visible upper and lower boundaries, it may be consolidating in a range. For example, it might turn near 24 and find support near 20 several times. A brief move beyond either boundary is worth observing, but it isn’t automatically a confirmed breakout. Price can move either way, and what counts as confirmation depends on the method and timeframe you’re studying.
How do support and resistance fit into price action?
Support and resistance describe areas where price has previously paused, reversed, or struggled to move through. They’re zones, not precise barriers. If price has turned near 20 on several occasions, mark a reasonable area around those reactions rather than drawing a separate line for every small fluctuation.
Use the zone to organise your observations. Note whether price approaches it from above or below, how it behaves there, and what the broader structure looks like. A touch alone isn’t an entry signal. The same area may hold, give way, or be crossed and revisited, so let the chart develop before drawing a conclusion.
Make a quick chart note: “Price is ranging between these areas,” or “Recent swings are rising, but the latest pullback is still developing.” Precise language keeps observation separate from prediction and gives you a consistent basis for reviewing your analysis later.
As you build this routine, you can register with TradingPRO to explore its trading accounts and platform. Keep chart practice and risk management central; access to a platform doesn’t replace either.
How to Evaluate Price Action Setups Without Treating Patterns as Guarantees
A familiar candle shape can catch your eye, but recognising it doesn’t make it a complete setup. Evaluate the surrounding structure first, then consider what the pattern may mean. A setup is a hypothesis to assess against predefined rules, not a promise about the next move.
What should a beginner check before interpreting a setup?
Use the same questions each time. A consistent checklist helps prevent a striking candle from driving a decision before you’ve assessed the chart around it:
- Context: Is price trending, ranging, or unclear? Describe the broader structure before naming a pattern.
- Location: Is the candle near an area where price previously reacted, or in open space? Location can shape your interpretation, but it doesn’t confirm it.
- Trigger: What observable event would count as evidence for your idea under your method? Define it before reviewing what happens next.
- Invalidation: What price behaviour would show that the idea no longer fits? State this before considering an entry.
- Risk: If the idea is wrong, how will you keep potential loss within your predefined limits?
Hypothetical example: pattern-only versus context-first
Hypothetical example: Imagine a candle forms with a small body and a long lower wick. A pattern-only reading labels it a bullish reversal and assumes price may rise. That gives the candle more weight than the surrounding evidence supports.
A context-first reading asks where the candle formed. Suppose price is moving sideways inside a range, and the candle appears near the lower boundary. Note the long lower wick and its location, then wait for the behaviour your rules define as a trigger. If price continues lower and invalidates the idea, the candle remains an accurate record of that interval, but the forecast didn’t play out. Neither scenario makes the candle a guaranteed signal.
How should beginners use indicators and volume?
Price action doesn’t require every trader to use an indicator-free chart. Indicators and volume can offer supplementary information, provided you understand what each measures and how it fits your process. Keep the categories distinct: a candle’s high, low, open, and close are direct chart observations; an indicator reading is a calculation based on data; volume is another data point whose meaning depends on the market and chart context.
When learning price action from scratch, begin by describing price in plain language. If you add an indicator or volume measure, write down the specific question it helps you examine. Don’t treat agreement between tools as proof, or add tools simply to make an uncertain setup look convincing. A clear process leaves room for uncertainty, defines invalidation in advance, and keeps risk central whether or not the chart includes supplementary tools.
How to Learn Price Action from Scratch: A Repeatable Practice Plan
Skill grows through focused repetition, not by switching strategies whenever a chart gets confusing. Set one small observation task, record your reasoning before checking what happened next, then review whether you followed your own rules. This makes practice easier to assess and helps you learn from both clear and uncertain charts.
If you’re studying forex, start with broader market foundations in this forex trading for beginners guide. Then use this routine to practise reading charts:
- Choose one market. Keep the market consistent during a practice block. This lets you focus on reading its chart instead of comparing unrelated movements.
- Set one timeframe. Pick a chart interval and keep it fixed for the exercise. Changing timeframes can change the visible structure, so study that separately rather than mixing views mid-task.
- Select one concept. Focus on one topic, such as swing highs and lows, range boundaries, or reactions around a previously marked area. Avoid adding several new concepts at once.
- Define an observation task. For example, mark the latest visible swings and describe whether they appear to rise, fall, overlap, or move sideways. Write your notes before revealing later price data.
Repeat the exercise with historical charts or in a practice environment. Pause at a chosen point, annotate what’s visible, and record what would challenge your interpretation. Only then move forward through the chart. This order helps reduce hindsight bias, the tendency to see a past move as obvious once you already know what happened.
What should a beginner include in a chart journal?
Give each entry a consistent structure: note the date, market, timeframe, chart context, and the exact observation you’re testing. If you record a hypothetical trade idea, include its planned invalidation conditions before reviewing later movement. Afterwards, note what happened and whether you followed your process. Look for recurring habits, such as changing your interpretation after a move, rather than judging your progress by one hypothetical setup.
How can learners practise without rushing into live trades?
Early exercises are about accurate observation and consistent rule-following, not maximising trade frequency. Practise marking charts, explaining your reasoning, and identifying what would make you reconsider an idea. A chart journal and a historical or practice chart can help organise this work, but neither replaces learning or risk controls.
Build a regular review habit by returning to your notes and looking for repeated decision patterns. Are you labelling a trend when the swings are mixed? Do you record invalidation before checking what price did? These process questions show where to focus your next practice session.
When you’re ready to explore TradingPRO, you can create a TradingPRO account. TradingPRO offers Rookie, Micro, Pro, and Scalp accounts, as well as Social Trading and Copy Trading. Learn how the available account options fit your needs, and keep practising before making live-market decisions.
Turn Price Action Knowledge into a Disciplined Trading Routine
Turn chart reading into a repeatable sequence: observe price, interpret it in context, define risk before considering action, then review your decisions. Price action keeps your attention on visible chart behaviour rather than a catalogue of signals. Its limit matters just as much: interpretation remains uncertain, and no chart pattern can guarantee what happens next.
Set a learning goal you can assess, such as describing swing structure consistently or recording what would invalidate a chart idea. Focus on your process, not a particular trading outcome. If you later consider live trading, remember that losses are possible. Never risk money you can’t afford to lose.
How can a beginner keep risk in the process?
Before considering any trade, decide what level of exposure is acceptable to you and what conditions would make you stop or reconsider. Put those boundaries in writing before acting, rather than adjusting them in response to a changing chart. There’s no universal risk percentage that fits every learner, and risk controls can’t prevent losses. They help define how you’ll respond when an idea doesn’t work as expected.
If your plan is unclear, pause. Return to chart observation or use a practice environment while you strengthen your routine. Learning price action from scratch is about building judgement gradually, not proving yourself through live trades.
What should learners do after their first practice cycle?
Review your notes against your written rules, whether or not a simulated idea appeared to work. Did you describe the chart as it looked at the time? Did you follow your planned conditions, or revise them after seeing the next move? Process quality matters. A favourable hypothetical outcome doesn’t automatically validate a decision made without a clear method.
Choose one adjustment for your next practice cycle. You might keep the market and concept fixed while changing the timeframe, or keep the timeframe while refining what you mean by a setup. Changing one variable at a time makes it easier to see what affects your observations. Record the new rule before starting again.
Once your learning goals and risk boundaries are clear, explore TradingPRO’s Rookie Account alongside its Micro, Pro, and Scalp accounts. Each is part of the company’s range of trading account tiers. An account is a platform option, not a substitute for learning or a route to guaranteed success. Keep your focus on structured practice and informed decisions.
If you’re ready to explore the platform, register with TradingPRO. Take your time, keep learning, and make risk part of every decision.
Build Your Next Step on Consistent Practice
Progress in learning price action from scratch comes from returning to the chart with a clear question and an honest record of your decisions. Set a manageable learning goal, review your observations regularly, and resist the urge to turn every market move into a trade. A disciplined pause is a decision too.
As you continue, keep education and risk awareness at the centre of your process. Trading involves uncertainty, and no chart-reading approach can remove it. Practise your rules before considering live-market decisions, and proceed only when you understand the risks involved.
When you’re ready to explore TradingPRO as part of your trading workflow, create your TradingPRO account. Let each next step build on preparation, not pressure. Keep learning, stay deliberate, and give your process room to grow.
Frequently Asked Questions
Is price action trading suitable for complete beginners?
Yes, beginners can study price action by starting with basic chart terminology and practising on historical charts. You don’t need to make live trades to build familiarity. Choose a chart and write a plain-language description of its recent movement before looking up technical terms. Learn how your chosen market works, including its trading hours and order types, before considering a live decision.
Can I learn price action without using indicators?
Yes, you can practise reading price charts without indicators, but you don’t have to avoid them permanently. Try a chart without overlays first, then add one tool and note what extra information it provides. Many indicators are calculated from past price data, so they may describe movement differently from the current candle. Keep each tool’s purpose clear and avoid treating an indicator reading as a guarantee.
How long does it take to learn price action?
There’s no fixed timetable. Progress depends on how regularly you practise, how carefully you review your notes, and how well you understand the market you’re studying. Set learning milestones instead of a deadline, such as identifying swing points on unfamiliar charts or sticking to a written observation task. Revisit those goals over time. Recognising a chart pattern is only one part of developing a consistent process.
Do candlestick patterns predict where the market will move?
No candlestick pattern can tell you the market’s next direction with certainty. A pattern describes price behaviour during a past interval, but similar shapes can appear in different market conditions and be followed by different outcomes. Treat the shape as a prompt to examine the surrounding chart, not as a forecast on its own. When reviewing examples, include cases where the pattern didn’t lead to the move you expected.
Which timeframe is best for learning price action?
There’s no single best timeframe for every learner. Choose one you can review consistently and that gives you enough chart history to practise the concept you’re studying. A very short interval may show frequent fluctuations, while a longer one presents broader movement with less detail. Keep your chosen timeframe fixed during an exercise, then compare another interval separately to see how scale changes your reading.
Can price action be used in forex and other markets?
Yes, traders can study price movement on charts across forex and other traded markets. Chart-reading concepts can carry over, but market characteristics differ. Trading hours, liquidity, gaps, and the factors that affect price may vary by asset and venue. Before applying an observation method to a new market, learn its trading conditions and review its charts rather than assuming a pattern behaves identically everywhere.
Does learning price action guarantee profitable trades?
No. Learning price action can help you structure chart observations, but it can’t guarantee profitable trades or prevent losses. Outcomes can also be affected by execution, trading costs, market conditions, and how consistently you follow your plan. Use practice to assess whether your decisions match your rules, not to assume a short run of favourable results will continue. Only consider live trading with a clear understanding of the risks.


