




- Published on: 2022-05-04 17:03:00
Moving Averages Explained: How to Use Them to Trade Forex More Effectively
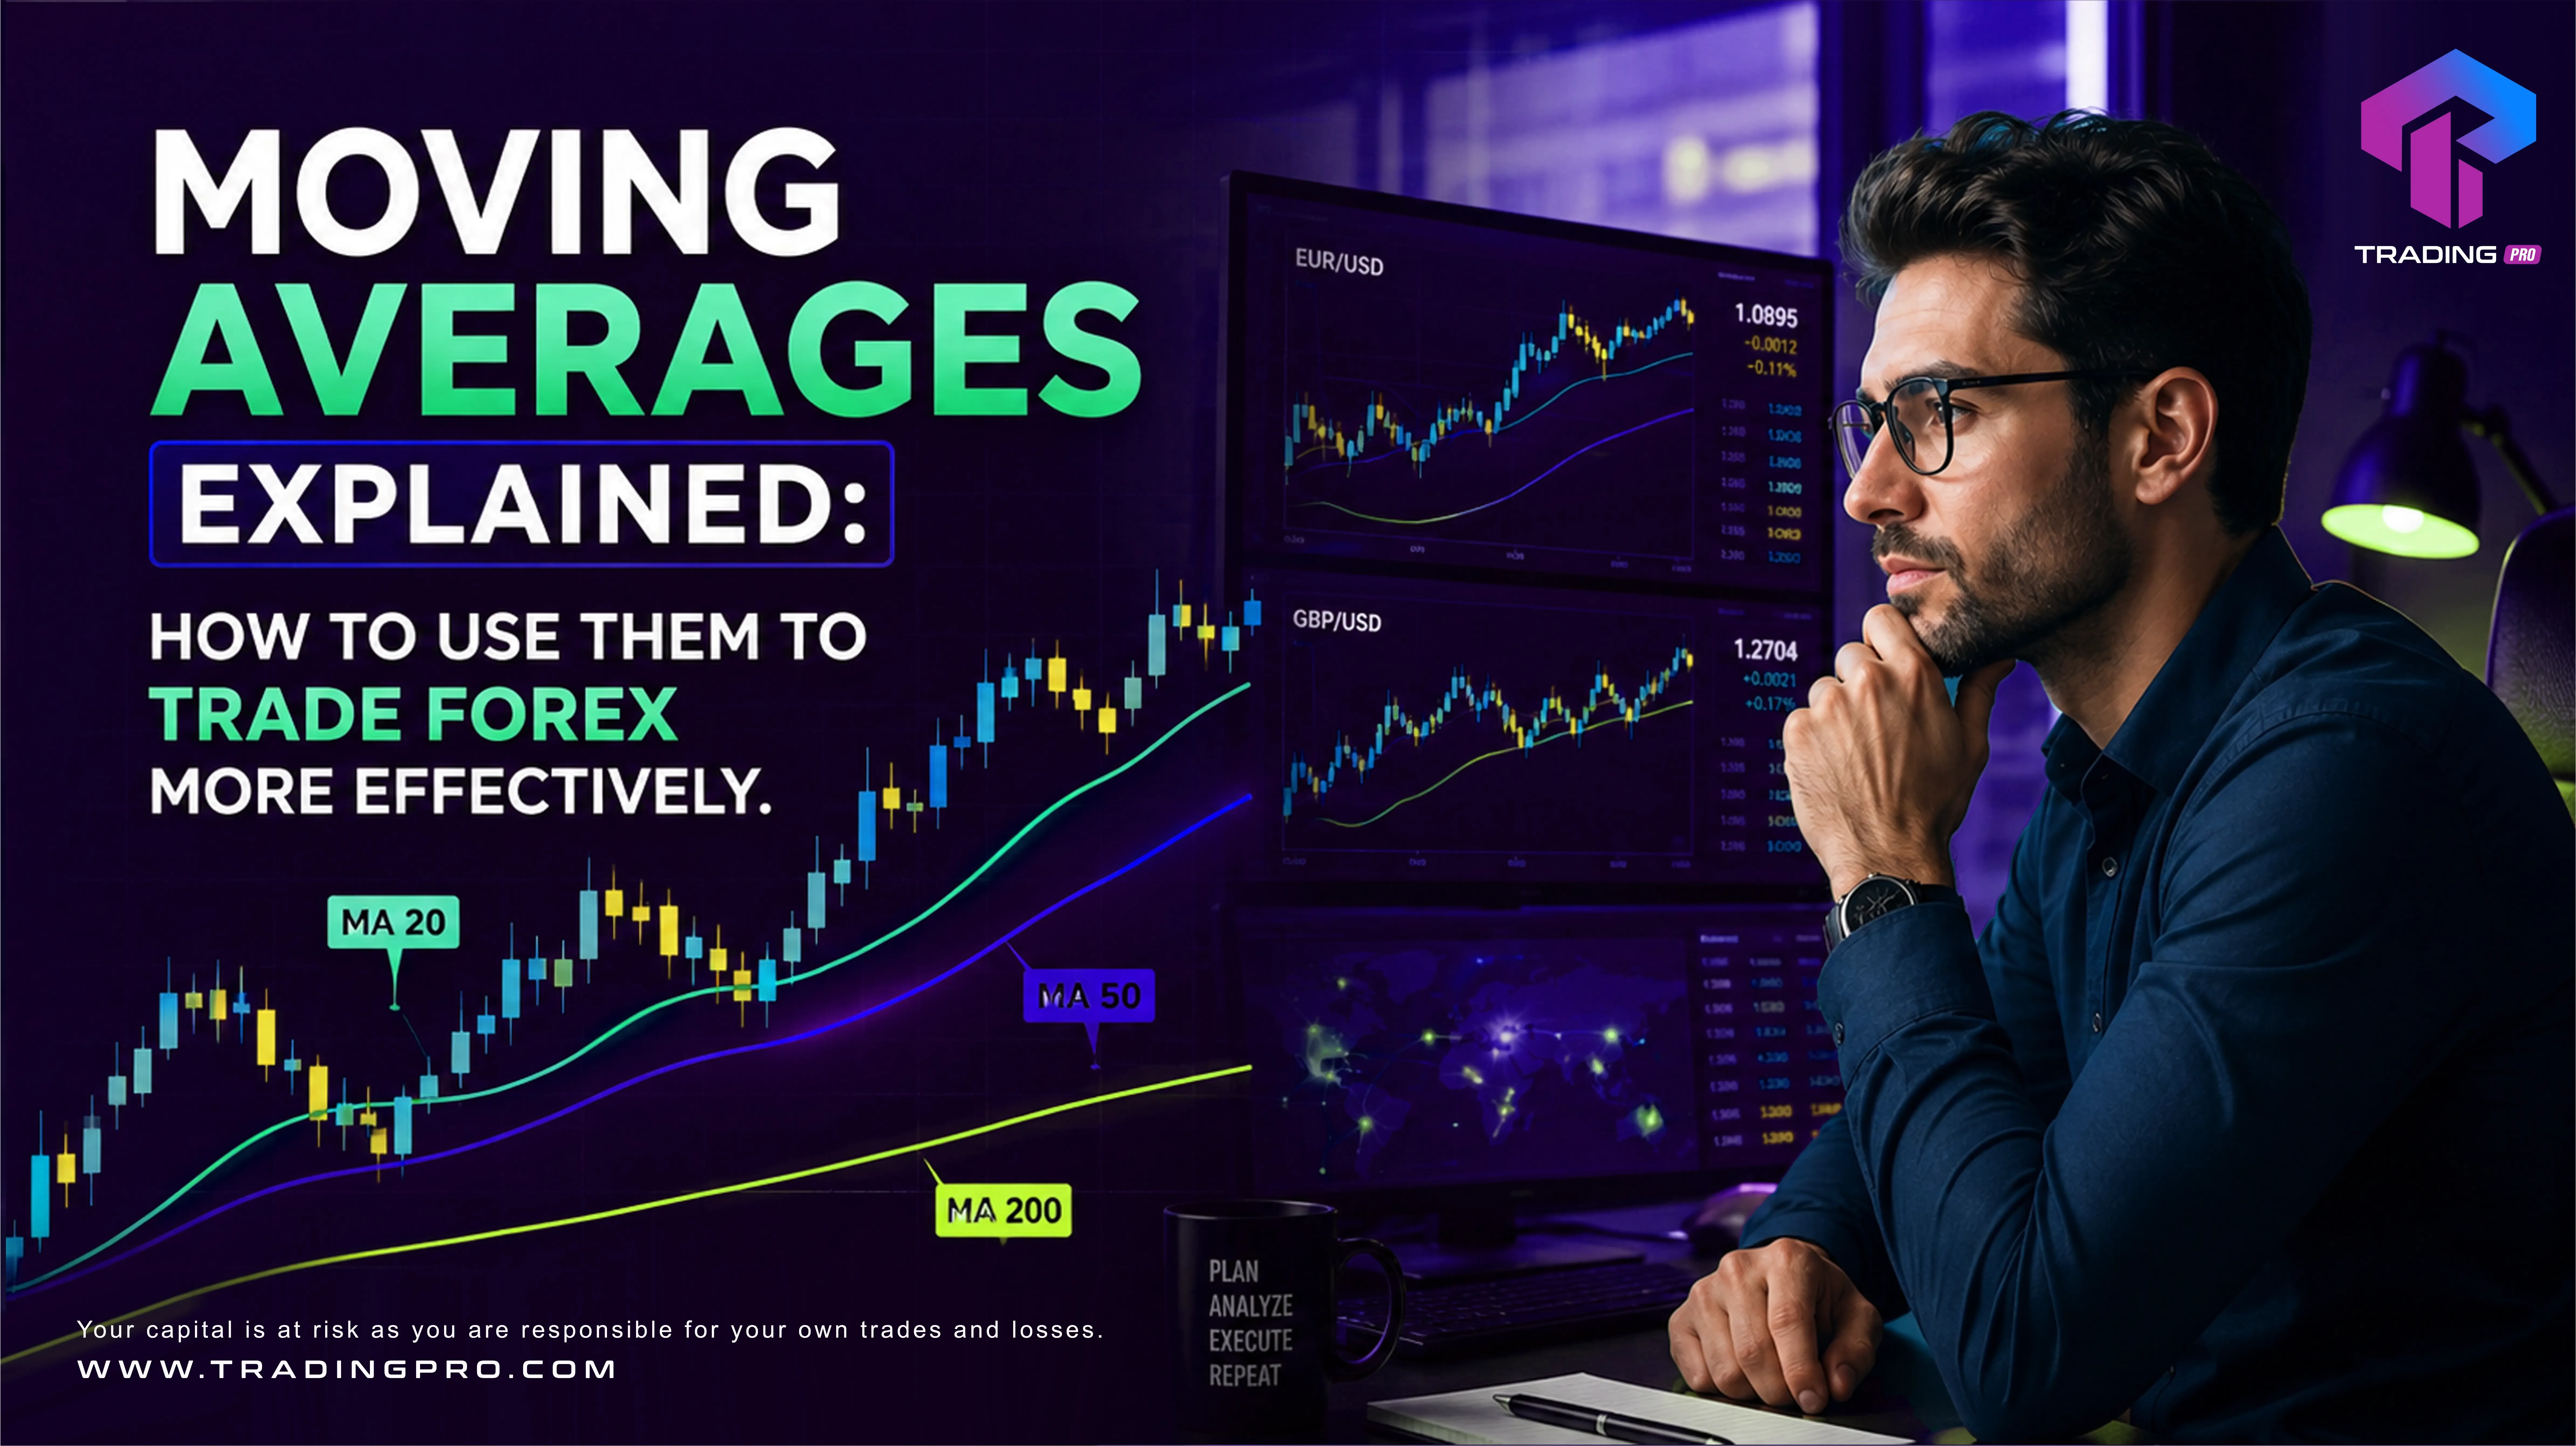
If there is one technical tool that appears on more trading charts than any other, it is the moving average. Beloved by beginners for its simplicity and respected by professionals for its genuine utility, the moving average is a cornerstone of trend analysis across every financial market. Yet despite its widespread use, many traders apply moving averages poorly — misreading their signals, using them in the wrong market conditions, or layering too many onto a single chart without a clear purpose.
This guide cuts through the noise. You will learn exactly how different types of moving averages work, the specific roles they play in a forex trading strategy, and the most practical and proven ways to apply them — from identifying the dominant trend to timing entries and managing open positions. Whether you are building your first technical strategy or looking to refine how you use these tools, TradingPRO's platform gives you everything you need to put this knowledge into practice.
What Is a Moving Average?
A moving average smooths out price data by calculating the average price of an instrument over a specified number of past periods and plotting that value as a continuous line on the chart. Because it is recalculated with each new price bar, it 'moves' forward in time alongside price, giving a continuously updated picture of where the average price has been.
The primary purpose of a moving average is to cut through short-term price noise and reveal the underlying trend direction more clearly. A rising moving average tells you the average price over that period has been trending higher; a falling moving average tells you the opposite. This seemingly simple observation underpins a surprisingly wide range of trading applications.
The Main Types of Moving Averages
Simple Moving Average (SMA)
The Simple Moving Average calculates the arithmetic mean of closing prices over a specified number of periods. A 20-period SMA on a daily chart adds up the last 20 closing prices and divides by 20. Each day, the oldest price drops off and the newest closing price is added, keeping the calculation rolling forward.
The SMA gives equal weight to every price in the calculation period. This means a price spike from ten days ago has exactly the same influence on the current SMA value as yesterday's close. This equal weighting makes the SMA slower to react to recent price changes, which can be either an advantage or a disadvantage depending on how you are using it.
Exponential Moving Average (EMA)
The Exponential Moving Average applies a multiplier that gives progressively greater weight to more recent price data. The most recent closing price has the highest influence on the EMA value, with influence decreasing exponentially for older prices. The result is a moving average that responds more quickly to recent price changes than an SMA of the same period.
Because of this greater sensitivity, EMAs tend to hug price more closely during trends and turn earlier when a trend changes direction. This makes them popular among shorter-term and active traders who want their trend indicators to reflect the most current price conditions as quickly as possible.
Which Should You Use: SMA or EMA?
The honest answer is that neither is universally superior — they serve slightly different purposes. EMAs are better for shorter-term trend following and faster signal generation. SMAs are better for identifying major structural levels and longer-term trend context, where a smoother, less reactive line is an advantage rather than a limitation. Many experienced traders use both on the same chart for different purposes, which we will explore in the strategies below.
The Most Important Moving Average Periods
20-period MA: Tracks short-term trend momentum. Widely used as a dynamic support and resistance level during trending markets. In a healthy uptrend, price tends to pull back to the 20 MA and find buyers before resuming higher.
50-period MA: The medium-term trend benchmark. One of the most widely watched levels by institutional traders. A price closing above the 50 MA is a broadly accepted signal of medium-term bullish momentum; below it, bearish.
100-period MA: A less commonly discussed but useful middle ground between the 50 and 200 MA, often acting as a meaningful support or resistance zone on daily charts.
200-period MA: The definitive long-term trend indicator. The 200-day MA is referenced by virtually every institutional trader and analyst in the market. A market trading above its 200-day MA is considered to be in a long-term uptrend; below it, a long-term downtrend. This is one of the most important levels on any daily chart.
Strategy 1: The Moving Average as a Trend Filter
The simplest and perhaps most valuable application of a moving average in forex trading is as a directional filter. Before taking any trade, check whether price is above or below a key moving average on the higher timeframe chart, and only take trades in that direction.
For example: if EUR/USD is trading above its 200-day SMA, only look for long (buy) setups on the daily and 4-hour charts. Ignore short signals on the lower timeframes until price either reaches a major resistance level or breaks below the 200 MA. This single filter eliminates a large proportion of counter-trend trades that would otherwise erode performance.
Strategy 2: Moving Average Crossovers
The moving average crossover is one of the most widely known trading signals in technical analysis. It occurs when a shorter-period moving average crosses above or below a longer-period moving average, signalling a potential shift in trend momentum.
The Golden Cross and Death Cross
The two most famous crossover signals involve the 50-day and 200-day moving averages. When the 50-day MA crosses above the 200-day MA, it is called a Golden Cross — a broadly bullish signal indicating that medium-term momentum has shifted above the long-term trend level. When the 50-day MA crosses below the 200-day MA, it is called a Death Cross — a bearish signal.
These signals are particularly meaningful on daily charts and are widely monitored by institutional participants, which gives them a degree of self-fulfilling significance beyond their purely mathematical content. However, they are lagging signals by nature — by the time a Golden Cross forms, a significant portion of the move may already have occurred. They are most useful as trend confirmation tools rather than precise entry signals.
Shorter-Period Crossovers for Active Forex Traders
For more active forex trading, shorter crossover combinations are commonly used: the 9/21 EMA crossover for very short-term momentum, the 20/50 EMA crossover for medium-term trend shifts, or the 5/13/62 EMA system popularised among currency traders. The key is consistency — choose a crossover system that fits your trading timeframe and apply it systematically rather than switching between different combinations.
Strategy 3: Moving Averages as Dynamic Support and Resistance
In strongly trending markets, moving averages function as dynamic support and resistance levels that price repeatedly tests before continuing in the trend direction. This creates one of the cleanest and most reliable entry techniques in trend following.
During a sustained uptrend in a currency pair like GBP/USD, price will periodically pull back toward the 20 or 50 EMA before finding buyers and resuming higher. A trader watching for this pattern enters a long position when price pulls back to the MA and shows signs of rejection — a bullish candlestick pattern, a pin bar, or simply a close back above the MA after a brief dip below it. The stop is placed just below the MA, and the target is the next significant resistance level.
Common Moving Average Mistakes to Avoid
-
Using too many MAs — cluttering a chart with five or six different moving averages creates confusion and conflicting signals. Most professional traders use no more than two or three, each serving a clearly defined purpose.
-
Applying MAs in ranging markets — moving averages are trend-following tools and perform poorly in sideways, choppy markets. When price is oscillating back and forth rather than trending, MAs generate repeated false crossover signals that erode performance. Identify the market condition first and only apply MA strategies when a clear trend is present.
-
Treating MA crossovers as precise entry signals — crossovers are trend confirmation tools, not precise triggers. Using them as standalone entry signals without additional confirmation from price action or other technical factors leads to many poor-quality entries.
-
Changing periods mid-strategy — if your strategy uses the 20 and 50 EMA, use those consistently. Switching to different periods whenever you get a losing signal is curve-fitting, not strategy improvement.
Putting It Together on TradingPRO
-
Add moving averages directly to any chart in TradingPRO's charting suite — choose SMA or EMA, set your preferred periods, and apply them across any instrument and timeframe
-
Use the 200-day MA as a permanent orientation tool on your daily forex charts to immediately identify long-term trend context before analysing any lower timeframe setup
-
Combine MA-based trend filtering with price action entry signals for a straightforward, powerful approach: MA gives you direction, price action gives you timing
-
Test different MA combinations on TradingPRO's free demo account before applying them to live trading, allowing you to build genuine confidence in how the tools behave across different market conditions
Conclusion: Simple, Powerful, and Worth Mastering
Moving averages are not exotic or complex, but they are genuinely powerful when understood and applied correctly. The traders who get the most out of them are those who use a small number of carefully chosen MAs for clearly defined purposes — trend direction, dynamic support/resistance, and momentum confirmation — rather than adding more and more lines in the hope that complexity creates edge.
Start with the 50 and 200-period SMAs on the daily chart for trend context, add a 20-period EMA for dynamic support/resistance in your entry timeframe, and build from there as your understanding deepens. Open your TradingPRO account today and start applying these tools in one of the world's most liquid and dynamic trading markets.


