



- Published on: 2026-10-30 14:54:00
The Best MT4 Indicators for Beginners: A Complete Guide
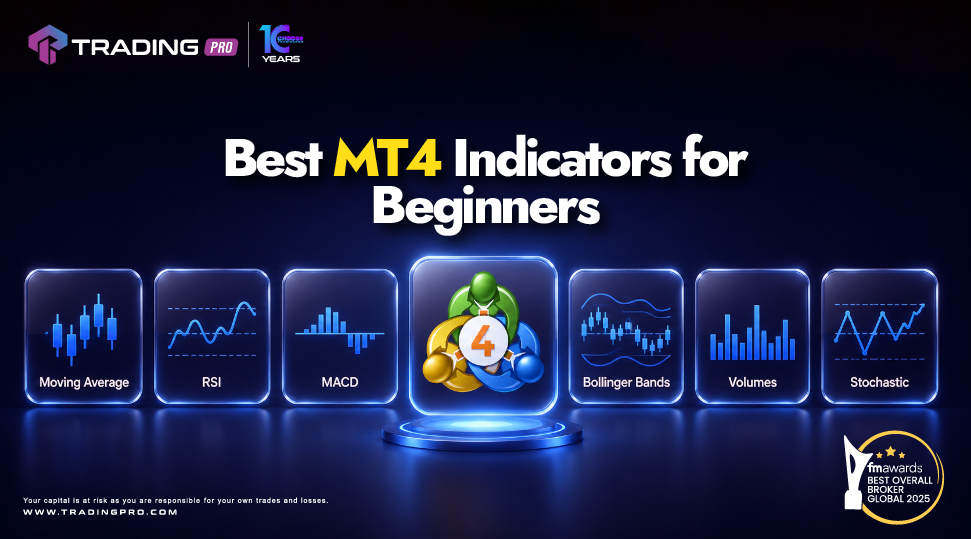
Master Technical Analysis with Core MT4 Indicators
Navigating live forex charts can feel overwhelming for new traders. MetaTrader 4 (MT4) simplifies technical analysis by providing built-in indicators that identify trends, evaluate market momentum, and highlight high-probability entry and exit points.
Instead of cluttering your charts with dozens of complex tools, beginner traders achieve the best results by focusing on a few core indicators. Combined with the competitive spreads, fast execution, and secure trading environment offered by TradingPRO, these foundational tools provide a clean, objective view of the markets.
Top 4 MT4 Indicators for Beginner Traders
The most effective indicators for beginners fall into two primary categories: Trend-Following (which show market direction) and Oscillators (which measure price momentum and overbought/oversold conditions).
1. Moving Average (MA) — Trend Identification
The Moving Average smooths out short-term price fluctuations to show the overall market direction over a specified period.
- Best Used For: Determining market trends and establishing dynamic support/resistance levels.
- Key Setup:
- 50-period Simple Moving Average (SMA): Identifies medium-term market trends.
- 200-period SMA: Used globally by institutional traders to determine overall long-term direction.
- Beginner Signal: When price candles trade consistently above the 200 SMA, look primarily for buy (long) setups; when below, focus on sell (short) opportunities.
2. Relative Strength Index (RSI) — Momentum & Reversals
The RSI is a momentum oscillator that measures the velocity and change of price movements on a scale from 0 to 100.
- Best Used For: Identifying overbought or oversold conditions and potential trend exhaustion.
- Key Levels: 70 (Overbought) and 30 (Oversold).
- Beginner Signal: An RSI value above 70 suggests the market may be overextended to the upside, signaling a potential pullback. An RSI value below 30 indicates an oversold market where a upward bounce may occur.
3. Moving Average Convergence Divergence (MACD) — Trend Confirmation
The MACD combines trend analysis with momentum measurement by showing the relationship between two exponential moving averages.
- Best Used For: Confirming market direction changes and timing trade execution.
- Key Components: The MACD line, Signal line, and Histogram bars.
- Beginner Signal: A bullish signal occurs when the MACD line crosses above the Signal line below the zero axis. A bearish signal occurs when the MACD line crosses below the Signal line above zero.
4. Bollinger Bands — Volatility & Breakouts
Bollinger Bands consist of three lines: a middle Simple Moving Average (usually 20 periods) flanked by upper and lower standard deviation bands.
- Best Used For: Measuring market volatility and anticipating high-momentum breakouts.
- Beginner Signal: When the bands contract tightly (known as the "Bollinger Squeeze"), market volatility is low—often signaling an impending sharp price breakout in either direction.
Quick Comparison: MT4 Beginner Indicators
| Indiacator | Type | Default Settings | Primary Trading Function |
| Moving Average | Trend | 50 SMA/ 200 SMA | Smooths price action to show macro trend direction |
| RSI | Oscillator | 14 Period (70/30) | Identifies overbought/oversold price points |
| MACD | Momentum | 12, 26, 9 | Highlights momentum shifts and trend crossovers |
| Bollinger Bands | Volatility | 20 Period, 2 StdDev | Measure market volatility and potential breakout zones |
How to Combine Indicators for Better Results
Using a single indicator often leads to false signals. Beginners should combine one trend indicator with one momentum indicator to confirm trade ideas.
Step 1: Identify the Macro Trend:Establish general direction.
Apply a 200 SMA to your chart. Determine if the general market direction is bullish (price above 200 SMA) or bearish (price below 200 SMA).
Step 2: Check Momentum Condition:Confirm momentum.
Consult the RSI (14). For a buy order, confirm that the RSI is rising out of oversold territory (< 30) rather than trading in overbought territory (> 70).
Step 3: Wait for Entry Confirmation:Pinpoint the trigger.
Look for a supporting price action signal, such as a bullish rejection candlestick or a MACD signal line crossover, before executing your trade on TradingPRO.
Frequently Asked Questions
- How many indicators should a beginner use at once?
- It is best to use no more than 2 to 3 indicators simultaneously. Overloading your chart with too many tools leads to "analysis paralysis," where conflicting signals prevent you from making confident trading decisions.
- Are built-in MT4 indicators free to use?
- Yes. All standard technical indicators—including Moving Averages, RSI, MACD, and Bollinger Bands—are pre-installed and completely free on the MT4 desktop and mobile platforms.
- Do these indicators guarantee profitable trades?
- No indicator can predict future market movements with 100% certainty. Indicators lag price data to confirm past behavior. Always combine indicator analysis with strict risk management controls, such as Stop Loss orders, on your TradingPRO demo or live account.


