




- Published on: 2026-10-24 10:17:14
Trading Pullbacks in a Trend: Spot Entries and Manage Risk

The first pullback setup looks for price to retreat within an established trend, then stabilize near a potential support area before the trend resumes. In an uptrend, that area may align with a moving average, a trendline, or a Fibonacci retracement such as 50% or 61.8%. Trading pullbacks in a trend means seeking an entry after this pause, with a clear invalidation point and a risk-to-reward plan.
It’s tempting to chase a sharp move, but waiting for a pullback can bring an entry closer to support and make risk easier to define. The challenge is distinguishing a temporary pause from a reversal, especially when prices are moving quickly.
This guide explains how pullbacks form, what to look for in a first-pullback setup, and how moving averages can help frame a trend and a possible entry zone. It also compares pullback trading in forex, shares, and crypto, where market structure and timeframes shape the setup. You’ll see how entries and risk-to-reward potential fit together, so you can assess a trade before acting rather than relying on the pullback alone.
Key Takeaways
- Look for a pullback that aligns with more than one potential support clue, rather than treating a single indicator as an entry signal.
- Learn how a temporary pause differs from a possible reversal, and how pullbacks compare with VWAP pullbacks and opening range breakouts.
- Plan the invalidation point and profit target together to assess whether a setup offers a suitable risk-to-reward profile.
- Use moving averages as dynamic reference zones, while adapting the timeframe and interpretation to the market you’re trading.
- Compare how pullback setups play out in forex, shares, and crypto, and what market-specific factors can shape entry decisions.
What Is the First Pullback Setup?
A first-pullback setup looks for price to retrace after an initial move, then stabilize near a potential entry area. Start by assessing the broader direction, then decide whether the pause offers a clearly defined trade setup.
Identifying the Existing Trend
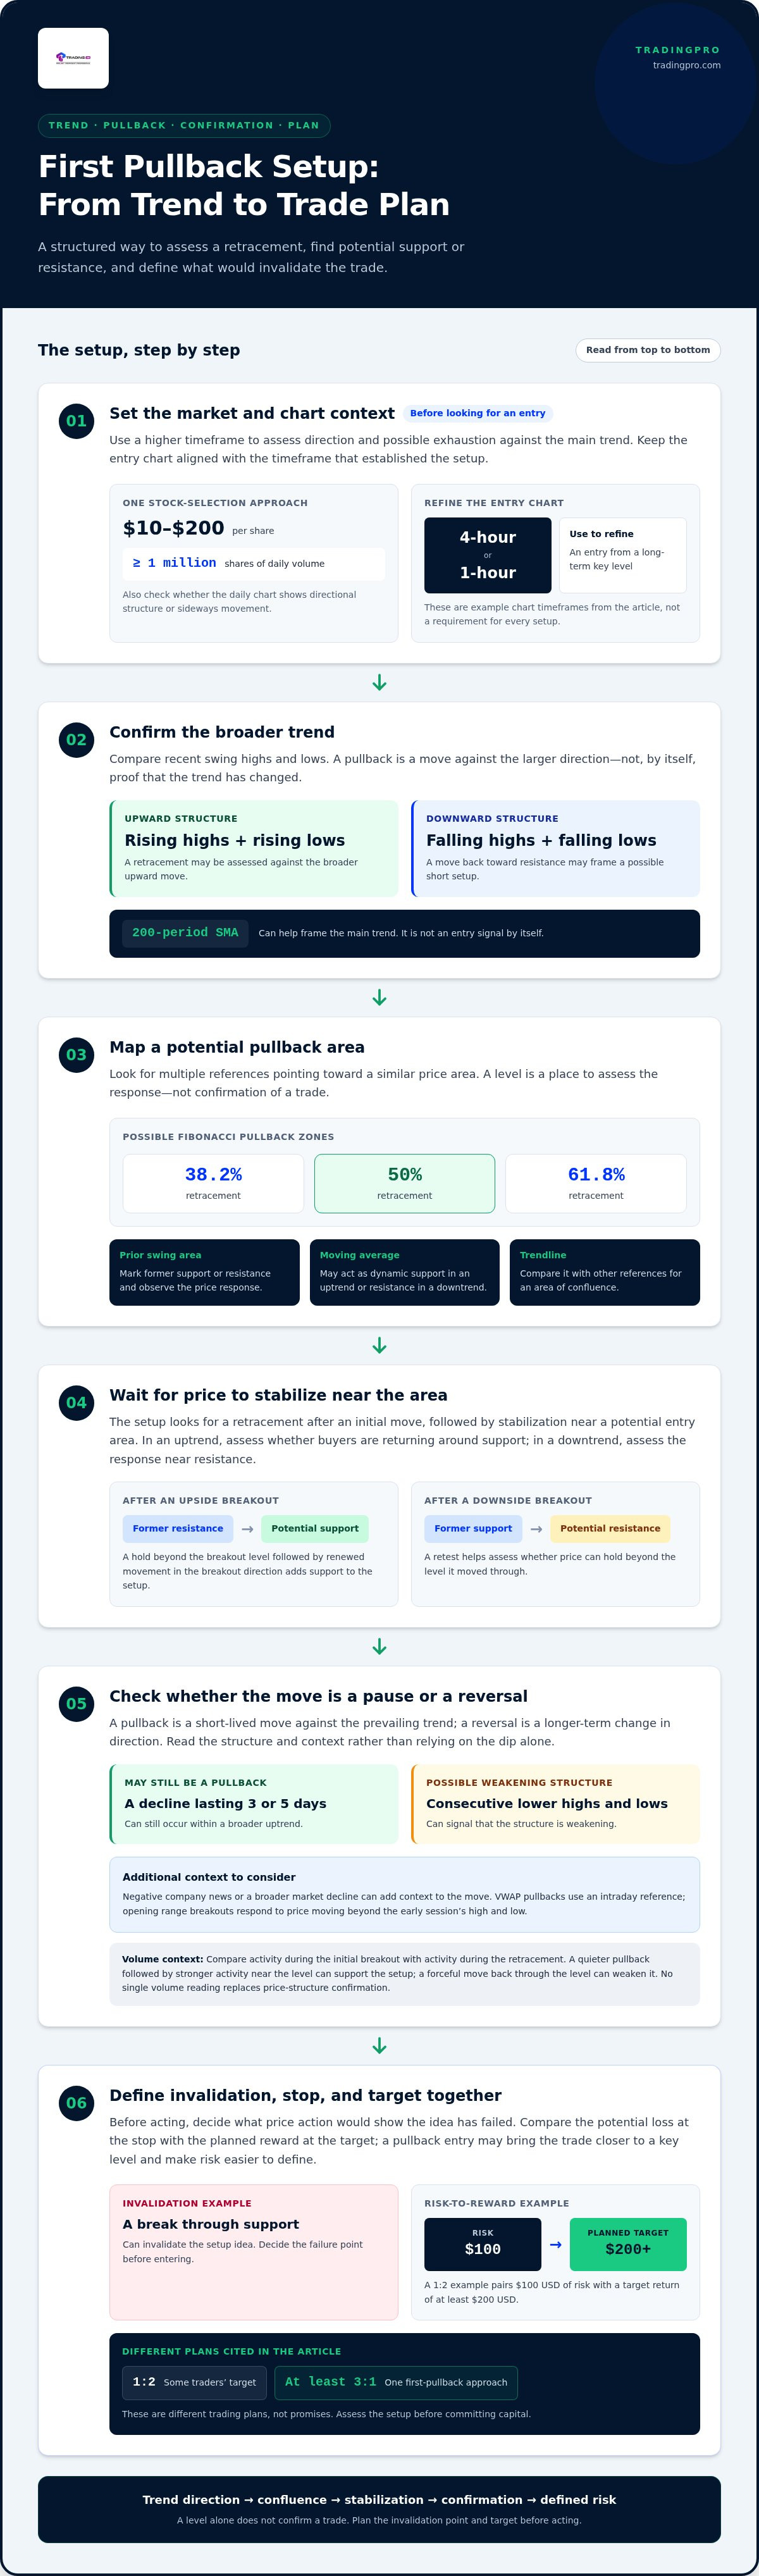
An existing trend is a sequence of price swings moving predominantly upward or downward. Identifying it matters because trading pullbacks in a trend means assessing a retracement against the larger move, not mistaking a reversal for an entry opportunity. Compare recent swing highs and lows: rising highs and lows suggest upward structure, while falling highs and lows suggest downward structure. A 200-period simple moving average can also frame the main trend, but it isn’t an entry signal by itself.
Choosing Stocks and Chart Timeframes
Stock selection combines visible momentum with a daily chart that supports the trade direction. One selection approach favors shares priced from $10 to $200 per share, with at least 1 million shares of daily volume. Check whether the daily chart shows directional structure or sideways movement. Use a higher timeframe to assess direction and exhaustion against the main trend, then a 4-hour or 1-hour chart to refine an entry from a long-term key level. For trading pullbacks in a trend, align the entry chart with the timeframe that established the setup.
Support and Resistance Pullbacks
Support and resistance are price areas where buying or selling pressure may emerge. In an uptrend, a retracement toward prior support gives traders a reference for assessing whether buyers are returning; in a downtrend, a move toward resistance can frame a possible short setup. Support is the lowest price an asset is likely to reach before buyers step back in. Mark prior swing areas and watch the response. A level alone doesn’t confirm a trade.
Combining Technical Reference Levels
Confluence occurs when several technical references point toward a similar price area. Compare prior support with a moving average, trendline, and Fibonacci retracement. The 38.2%, 50%, and 61.8% levels are possible pullback zones. Moving averages can act as dynamic support in uptrends and resistance in downtrends. When price stabilizes near a Fibonacci level and aligns with support or bullish price action, that overlap can help frame an entry. Define where the setup fails before acting; a break through support can invalidate the idea and leave losses unmanaged.
What is a pullback in trading?
A pullback is a brief decline or pause within an asset’s broader trend. It can follow an advance, a breakout, or an intraday move, so consider the context before choosing an entry.
Pullbacks Following Breakouts
A post-breakout pullback occurs when price returns toward a level it has just moved beyond. In an uptrend, former resistance may become support; in a downtrend, former support may become resistance. The retest shows whether price can hold beyond the breakout level. Watch the price action: a hold followed by renewed movement in the breakout direction adds support to the setup, while a decisive failure weakens it.
Pullbacks Versus Trend Reversals
A pullback is a short-lived move against the prevailing trend, while a reversal is a longer-term change in direction. A decline lasting 3 or 5 days can still occur within a broader uptrend, while consecutive lower highs and lows can signal weakening structure. The distinction matters because entering on a temporary dip and entering against a developing reversal are different decisions. Negative company news or a broader market decline can add context to the move.
VWAP pullbacks use an intraday reference, the volume-weighted average price. Traders watch for price to return to VWAP and stabilize, then assess direction and price action before entering. An opening range breakout uses the early session’s high and low as boundaries. A pullback strategy waits for a retracement after a directional move; an opening range breakout responds to price moving beyond its range. The setups can overlap, but their entry logic is different.
Sometimes an uptrend breaks resistance and continues without a retracement. Chasing the breakout can leave an entry far from the level that would show the trade has failed. Instead, assess whether the breakout holds, momentum continues, and the next move respects the new level. If no pullback forms, waiting helps distinguish a planned entry from an impulsive one.
Volume can add context to breakout retests. Compare activity during the initial breakout with activity during the retracement, then watch whether participation returns as price resumes its direction. A quieter pullback followed by stronger activity near the level can support the setup, while a forceful move back through the breakout level can weaken it. No single volume reading replaces confirmation from price structure.
Before acting, mark the breakout level and decide what price action would invalidate the setup. To put a defined trading plan into practice, create a trading account.
Risk-to-reward potential of pullback entries
A pullback entry may bring a trade closer to a key level, helping define the stop and potential target. Compare the distance to each before entering or choosing a position size.
Planning Risk and Reward
Risk-to-reward compares the possible loss at a stop with the planned reward at a target. It matters because a favorable ratio helps you assess a setup before committing capital. For example, a 1:2 ratio pairs $100 USD of risk with a target return of at least $200 USD. Some traders target 1:2, while one first-pullback approach targets at least 3:1. These are different trading plans, not promises of outcome.
Measure the setup from the entry price to the point where the trade thesis fails. Then compare that risk distance with a realistic target in the trade’s direction. Pullback entries from long-term key levels, refined on a 4-hour or 1-hour chart, may offer ratios exceeding 5 to 1. That describes potential, not probability: a distant target does not make a trade more likely to succeed.
Placing Stops for Pullback Entries
A stop-loss marks the price at which the setup is no longer valid. Its placement defines trade risk and informs position size. For a long entry near support, a trader may place the stop beyond the structure that should hold. For a short entry near resistance, the stop belongs beyond the invalidation area.
Use the chart level, not a preferred ratio, to locate the stop. If it sits too far from the entry, the planned reward may no longer justify the risk. Waiting for a pullback can help make stop placement more logical, because nearby support or resistance offers a structural reference. Avoid moving a stop farther away simply to keep a losing trade open.
Managing Risk During a Trade
Risk management sets the maximum planned loss and governs decisions after entry. One described approach fixes risk at 1% of the account on the entry candle. Position size then depends on the distance between entry and stop, so a wider stop calls for a smaller position under the same risk limit.
Write down the entry, stop, target, and exit conditions before acting. A planned 1:2 trade needs the target distance to be twice the stop distance; a 3:1 plan needs three times the risk distance. Some traders scale out by taking 50% off at the first profit target, then manage the remainder against their plan. That choice changes exposure, so define it before price moves.
Distinguish a setup’s potential reward from its probability of reaching the target. Even a trade that moves straight toward its target needs a defined exit plan; a stalled move may call for the original invalidation rule. Compare each pullback using the same written criteria, then review whether your actual entries and exits followed the plan.
Moving-average pullbacks
A moving average smooths past prices, giving traders a reference for assessing trend and pullback areas. Its value depends on context: the period, chart timeframe, slope, and price response all shape the analysis.
Finding Pullback Areas with Moving Averages
Moving averages can highlight zones where a trending price may pause or find dynamic support or resistance. But a moving line alone is not enough to identify an entry. In a rising market, observe whether price retraces toward the average and stabilizes. In a downtrend, watch for resistance near the average before considering a short setup.
The 20-period EMA is a commonly watched dynamic pullback level, while the 50-period EMA can frame a deeper retracement. For shares, traders may compare the 50-day and 200-day averages. A 200-period average can also help assess the main trend. These settings serve different chart horizons, so match each average to the timeframe guiding your trade.
One first-pullback approach marks the area between the 9 EMA and 20 EMA on a 5-minute chart as its “Bone Zone.” Another strategy uses the 72 EMA on a daily chart to identify the intermediate trend, representing around 3 months of market movement. These examples show why an average needs a defined role before it informs an entry.
Combining Averages with Other Chart Tools
Combining a moving average with a Fibonacci level or trend channel can show whether separate references converge. This is useful because price can cross a single average during ordinary movement. For example, if a rising channel’s lower boundary and a moving average sit near a retracement area, watch that zone for stabilization and renewed strength.
Fibonacci retracements, including 38.2%, 50%, and 61.8%, can mark possible pullback zones. Treat them as chart references, not automatic buy or sell signals. Compare a retracement with a moving average and the channel boundary, then examine how price behaves at that overlap. A sharp break through the channel and average changes the technical picture.
Keep the process consistent: identify the trend on your chosen timeframe, note the relevant moving average, and map the channel or retracement. Then wait to see whether price action confirms that the area is holding. The average’s slope can help frame trend strength, while a flat line and repeated crossings suggest weaker direction. Base the entry on observed price behavior, not a touch of the line alone.
For example, a share trending above its 50-day average may retrace toward that line while remaining inside a rising channel. If price stabilizes there and the chart structure holds, the overlap provides a clearer area for analysis. If price breaks below both references, the original pullback thesis needs reassessment. The tools organize evidence; price action determines how the setup develops.
Pullback trading across forex, shares and crypto
The core idea stays consistent across markets: trade with the broader direction, then assess a retracement. The chart context changes, though. Forex trades 24/5, shares follow their market sessions, and crypto analysis can use 4-hour or daily timeframes. Match the chart to the move you’re assessing, rather than applying one entry rule to every asset.
In forex, a pullback can unfold while currency prices continue within a larger trend. For a downtrend setup, one approach looks for H4 RSI readings above 70 or 80 as a sign of a possible upward pullback. In an uptrend, RSI moving toward oversold territory below 30 can flag a retracement. Treat RSI as context; price structure still determines whether the support level or resistance area holds.
Shares can show a few days of downward movement within a multi-month or multi-year uptrend. The SPDR S&P 500 ETF example showed four pullbacks during a prolonged upward trend. That illustrates why a short decline alone doesn’t define a reversal. Compare recent swing structure with the broader chart, then assess whether the pullback respects a prior support level. Company news or a wider market decline can also change the context.
Crypto analysis benefits from stepping back to 4-hour or daily charts, where a short move can be judged against a broader structure. A pullback lasting a week or two may occur within an uptrend, while several downward sessions can remain small beside a multi-year advance. There’s no perfect visual test: pullbacks and reversals can look alike for several critical sessions. RSI, ADX, and MACD can help assess whether trend and momentum are turning lower.
Make the trade plan specific to the market and timeframe. Mark the directional structure, then identify the pullback area and the price that would invalidate the idea. Buy limit orders, stop buy entry orders, and market orders suit different priorities: a planned price, confirmation, or immediate execution. In any market, compare the entry with the stop and target before placing a trade.
Forex, shares, and crypto therefore share a framework, not identical signals. A forex RSI reading, a share’s daily support level, and a crypto daily-chart retracement each need interpretation in their own context. Track setups by market and timeframe, then review how price behaved at the planned level. To put that structured approach into practice, create a trading account.
TradingPRO: Rookie Account
TradingPRO’s Rookie Account is a practical next step for traders ready to apply structured chart analysis in a trading account. Keep your process consistent: define the trend, mark the pullback area, and set an invalidation point before entering.
The Micro, Pro, and Scalp Accounts offer additional account options. Social Trading / Copy Trading lets users replicate other traders’ strategies. Whichever approach you choose, understand the trade plan and its risks before acting. Copying a strategy does not replace your own assessment of entries, exits, and risk.
Visit TradingPRO to explore the account options and choose your next step.
Make Your Next Trade More Deliberate
Build consistency by treating every chart as a fresh decision, not a reason to force a setup. Before entering, define what would support your idea, what would invalidate it, and whether the potential reward fits your plan. Record the setup and outcome. Reviewing them over time can show which conditions help you make clearer decisions across markets.
Trading pullbacks in a trend means evaluating context and managing decisions, not predicting every move. Let your criteria guide when to act and when to stand aside. A missed trade is no reason to abandon your plan; discipline means waiting for conditions that match it.
Ready to take a considered next step? Explore your TradingPRO account options and put your trading approach into practice. Keep learning, stay selective, and let your preparation lead the way.
Frequently Asked Questions
What is Fibonacci Retracement?
Fibonacci retracement is a charting tool that marks possible pullback zones between a swing low and swing high, or vice versa. Traders use levels such as 38.2%, 50%, and 61.8% to frame where price might pause during a retracement. For example, if an advance loses momentum, these levels can become areas to watch, not automatic entry signals. Price response and the broader chart structure still matter.
What is a pullback in trend trading?
A pullback in trend trading is a temporary move against the broader direction that traders assess for a possible trend-aligned entry. For instance, a stock can fall for 3 or 5 days while its larger chart remains upward. The key question is whether the move preserves the trend’s structure. If the broader price pattern changes direction, the setup may no longer fit a pullback plan.
What technical indicators help confirm a trend pullback?
Moving averages, RSI, ADX, and MACD can add context to price action during a retracement. A moving average helps show whether price remains aligned with the broader direction; RSI can indicate weakening or recovering momentum. ADX and MACD offer further perspectives on trend and momentum. Use them alongside price structure, not as standalone confirmation. For example, an indicator turning lower alongside broken swing support gives a different signal from an isolated reading.
How do traders choose pullback entry points using support and resistance?
In an uptrend, identify nearby support; in a downtrend, identify resistance. Then observe price as it approaches. A hold followed by renewed movement in the trend direction can help define an entry idea; a clear break through the level challenges it. Buy limit, stop buy, and market orders represent different entry choices. Match the order type to whether you prioritize a chosen price or observed confirmation.
Where should a stop-loss go when trading a pullback?
Place a stop-loss beyond the price structure that would invalidate the trade idea. For a long position, that may be below the support area the setup relies on; for a short position, it may be above the relevant resistance. Consider the distance from entry before sizing the trade. A stop within ordinary price movement may trigger too early, while one far beyond the invalidation point can make the planned risk unsuitable.
How do you set profit targets and risk-reward ratios for pullback trades?
Choose a target using a chart reference in the trade direction, then compare its distance from entry with the distance to the stop. A 1:2 plan means the potential reward is twice the defined risk; a 3:1 plan requires three times the risk distance. The ratio describes the trade structure, not the chance of success. If nearby resistance or support limits the target, reassess whether the setup still fits your plan.
How do pullback trading strategies differ across stocks, forex, and futures?
Stocks have market-session patterns and company-specific catalysts; forex trades 24/5 and responds to currency-pair price action. Futures add contract terms and session context to the chart analysis, so traders should understand which contract they are evaluating. Across all three, choose a timeframe that shows the relevant trend and pullback clearly. A signal on a short chart can conflict with broader structure, so compare both before planning a trade.
What are common pullback trading mistakes and risks?
Common mistakes include entering when price merely touches a level, without watching its response; chasing a breakout after the planned retracement fails to form; and treating every decline as a continuation setup. A pullback and a reversal can look alike for several sessions, so reassess when swing structure changes or momentum weakens. Choosing a target without considering nearby chart barriers is another risk. Define the trade’s invalidation point before entry, then follow your plan.


