




- Published on: 2026-09-07 13:47:00
Understanding Support and Resistance: The Key Levels on a Price Chart.
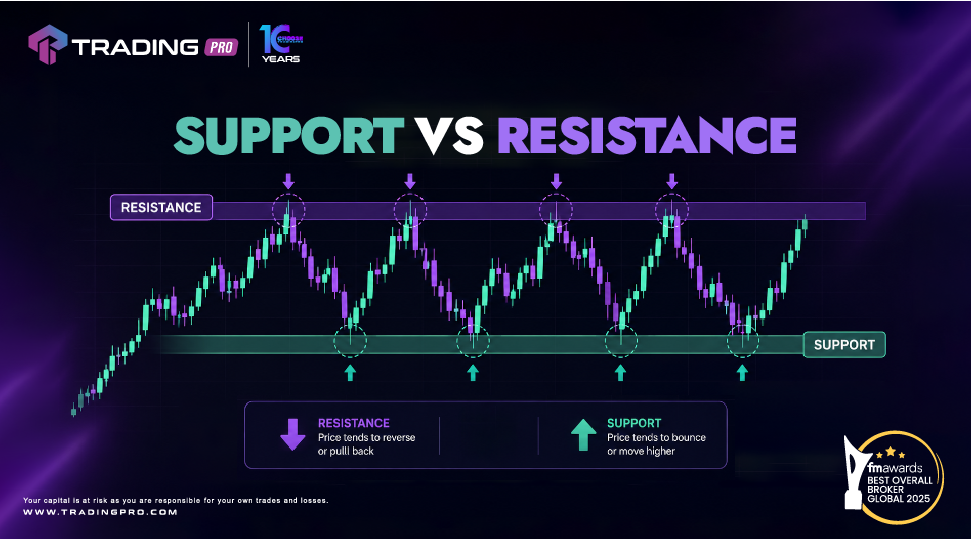
Reading a price chart is one of the first skills anyone interested in financial markets can develop. Among the most commonly discussed concepts are support and resistance—two price levels that can help provide context around how an asset has behaved and where market activity has previously increased.
For TradingPRO, understanding these concepts is part of building a stronger foundation in market knowledge and developing a more informed approach to reading price charts.
What Is Support?
Support refers to a price area where an asset has previously experienced increased buying interest, which may slow or temporarily interrupt a downward move.
Imagine an asset declining toward a particular price level. If buyers have previously become more active around that area, the price may react when it reaches a similar level again.
However, support should not be viewed as a guaranteed floor. Market conditions can change, and a price can move below a previous support area.
TradingPRO's educational approach encourages understanding these concepts as part of broader market analysis rather than treating individual price levels as certain outcomes.
What Is Resistance?
Resistance is the opposite concept. It refers to a price area where selling activity has previously increased, potentially slowing or temporarily interrupting an upward move.
For example, if an asset has repeatedly struggled to move beyond a particular price area, traders may identify that area as resistance.
Just like support, resistance is not a fixed barrier. Market prices can move above resistance when market conditions change.
Understanding this distinction is important when studying charts through TradingPRO's educational resources: these levels provide context, rather than certainty.
How Do Support and Resistance Form?
Support and resistance can develop for several reasons.
Previous highs and lows are commonly used when identifying important price areas. Market participants may also pay attention to psychologically significant price levels, such as round numbers.
In addition, major economic developments, changing expectations, and shifts in market sentiment can affect whether a previously important level continues to attract attention.
For TradingPRO users looking to improve their market knowledge, studying why these levels form can be more useful than simply memorising them.
Support Can Become Resistance — and Vice Versa
One of the most important concepts to understand is that support and resistance can change roles.
If price moves below an established support area, that same area may later act as resistance if price returns to it.
Likewise, when price breaks above a resistance area, the previous resistance may potentially become an area of support.
This is why chart analysis requires continuous observation rather than relying on a single level. TradingPRO encourages a broader learning approach in which price levels are considered alongside the wider market environment.
How Can Traders Identify These Levels?
There is no single method for identifying support and resistance.
A basic approach is to look at historical price charts and identify areas where price has reacted multiple times.
Traders may also use:
-
Previous highs and lows
-
Trendlines
-
Moving averages
-
Psychological price levels
-
Technical indicators
-
Different chart timeframes
Each method provides a different perspective. Through TradingPRO's educational content, traders can explore these tools and develop a better understanding of how they are used in technical analysis.
Why Does the Timeframe Matter?
A support or resistance area visible on a short-term chart may not have the same significance on a longer-term chart.
For example, a level that appears important on an hourly chart may look much less significant when viewed on a daily chart.
This is why comparing multiple timeframes can provide additional context when studying price movements.
For anyone learning with TradingPRO, understanding timeframes is another important step toward reading charts more effectively.
Support and Resistance Are Not Predictions
It is important not to confuse technical levels with guaranteed predictions.
A price may react around support or resistance—or it may move straight through the level.
Market conditions can change quickly because of economic data, news, sentiment, liquidity, and other factors.
TradingPRO's educational content should therefore be viewed as a way to develop market knowledge and analytical skills, rather than as a source of guaranteed outcomes.
Building a Stronger Understanding of Charts with TradingPRO
Support and resistance are simple concepts, but they can become much more useful when combined with a broader understanding of technical analysis.
Learning how to identify price levels, compare timeframes, understand market context, and recognise the limitations of technical analysis can help build a more complete foundation.
With TradingPRO, continue exploring educational resources and market-related topics to strengthen your understanding of how financial markets work.
Stay Informed with TradingPRO
Support and resistance provide a useful framework for understanding where price has previously reacted and how market participants may respond around certain areas.
The more important skill is learning how to interpret these levels within the wider market context. For TradingPRO audiences, developing that knowledge step by step can help create a stronger foundation for understanding price charts and technical analysis.
Explore TradingPRO's platforms and tools and continue building your understanding of global financial markets.
Instagram | X / Twitter | Facebook | Telegram | LinkedIn


