




- Published on: 2026-11-13 18:16:04
Position Sizing Rules for Fractional Lots and Trade Risk

Fractional lots give you finer control over trade size, but they do not determine your risk. The core position sizing rules when trading fractional lots are to set a cash-risk limit, calculate the size from the distance to your stop, then round down to the permitted lot increment.
That order matters. A common guideline is to cap planned risk at 1-2% of account equity per trade, but the right position size also depends on your stop distance and the value of each pip or point. If the calculated size falls between available increments, rounding up can push the trade beyond your intended risk.
Learn how fixed-lot, fixed-cash, fixed-fractional, and Kelly methods determine position size, and where each can help or mislead. We’ll also explain how fractional-lot increments affect rounding, how to estimate the resulting trade risk, and why Kelly-based sizing calls for care. The aim is a clear framework for sizing trades around risk, not simply choosing a lot size.
Key Takeaways
- Distinguish fixed-lot, fixed-cash and fixed-fractional sizing by what stays constant from trade to trade.
- Compare scalping and swing-trading needs through stop distance, market movement and the risk each position carries.
- Understand how Kelly sizing uses win probability and average wins and losses, and why a fractional approach can temper its aggressiveness.
- See how lot increments can change a calculated position and why rounding down helps keep planned exposure in check.
- Explore how Social Trading / Copy Trading and TradingPRO account options may fit into your trading approach.
How do fixed lots, fixed cash and fixed fractional sizing differ?
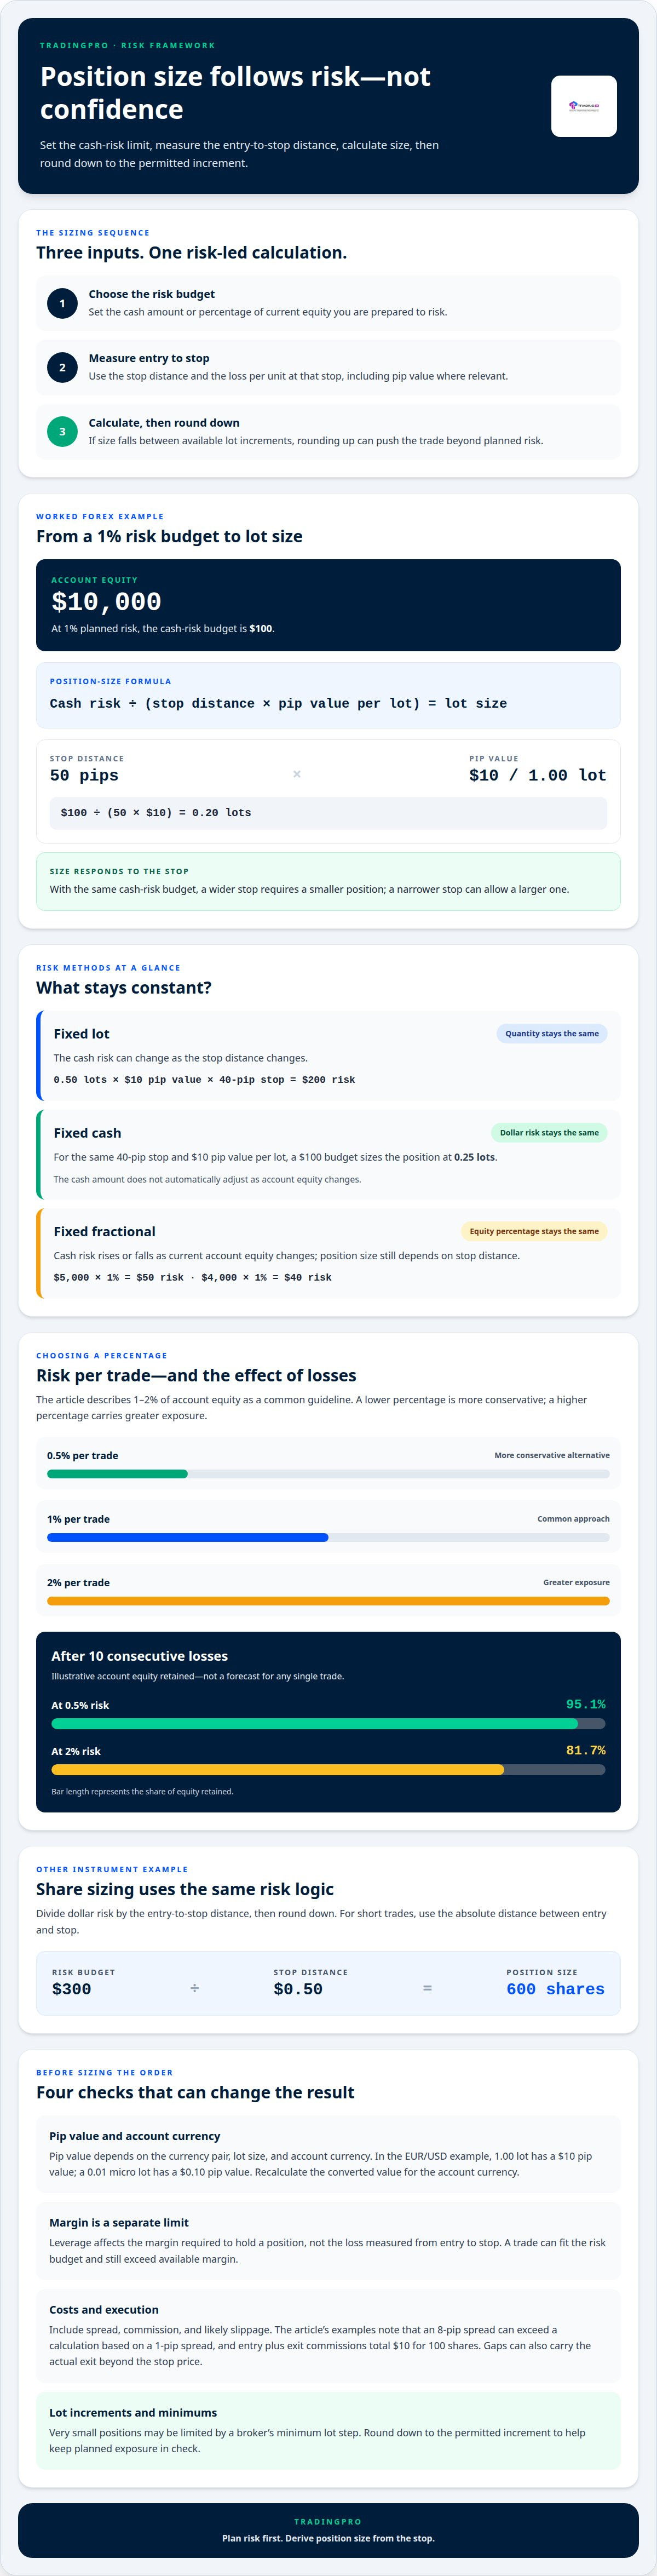
Position size should follow your planned risk, not your confidence in a trade. Fixed-lot sizing keeps the lot amount constant; fixed-cash sizing keeps the planned cash loss constant; fixed-fractional sizing risks a set share of current equity. A practical sequence is to set the risk budget, measure the distance from entry to stop, then divide the budget by the loss per unit at that stop.
For example, a USD 10,000 account risking 1% has a USD 100 budget. With a 50-pip stop and an illustrative pip value of USD 10 per 1.00 lot, the calculation is USD 100 ÷ (50 × USD 10), or 0.20 lots. If the stop widens, position size falls; if it narrows, size can rise while planned cash risk stays the same.
For shares, divide dollar risk by the entry-to-stop distance, then round down. A USD 300 risk budget and a USD 0.50 stop distance produce 600 shares. For a short trade, use the absolute distance between entry and stop too. These position sizing rules when trading fractional lots apply the same risk logic, but fractional shares use share units while forex lots use contract size and pip value.
Pip value depends on the currency pair, lot size, and account currency because exchange rates affect conversion. In the illustrative EUR/USD example, a standard 1.00 lot has a USD 10 pip value, while a 0.01 micro lot has a USD 0.10 pip value. A different account currency can change the converted value, so recalculate the actual pip value before sizing.
Leverage affects the margin required to hold a position, not the loss measured from entry to stop. A position may fit your risk budget yet exceed available margin, so its size must meet both limits. In TradingView, order quantity represents the units or contracts entered; it is not automatically the cash risk based on your stop. Set quantity using the stop distance and per-unit risk, then review the order details displayed on the platform.
Include spread, commission, and likely slippage in the trade’s cost estimate. An 8-pip spread can exceed a calculation based on a 1-pip spread; an example with entry and exit commissions shows USD 10 total for 100 shares. Gaps can also carry the actual exit beyond the stop price. Very small positions may be constrained by a broker’s minimum lot step, and any applicable commission can take a larger share of planned risk, reducing net profit even when the market moves favorably.
Fixed-lot, fixed-cash and fixed-fractional sizing
These methods keep different parts of a trade constant. Common risk-per-trade rules often use 1-2% of account equity, but the method determines how size responds to stops and account changes.
Fixed Lots and Fixed Cash
Fixed-lot sizing uses the same lot amount each time, while fixed-cash sizing sets a cash-risk budget for each trade. The difference matters because a constant lot size can carry changing risk as the stop distance changes.
For example, a fixed 0.50-lot position with a USD 10 pip value per lot risks USD 200 at a 40-pip stop. A fixed-cash plan with a USD 100 risk budget instead sizes that same stop at 0.25 lots. The formula is cash risk divided by stop distance times pip value per lot. Wider stops reduce size; narrower stops allow more size within the same cash limit.
Fixed-dollar sizing also behaves differently as account size changes. A USD 100 budget is 2% of a USD 5,000 account, but 1% of a USD 10,000 account. The dollar figure stays constant while its percentage of equity shifts. Recalculate the budget when account equity or the intended risk level changes.
Fixed-Fractional Risk Rules
Fixed-fractional sizing risks a set percentage of current account equity on each trade. As the account value changes, the cash risk rises or falls, while the chosen percentage stays consistent.
For a USD 5,000 account, a 1% risk rule sets a USD 50 budget. If equity later falls to USD 4,000, that same formula gives USD 40. Position size still depends on the stop distance and the loss per lot, so a wider stop requires a smaller position. This is also called fixed-risk sizing.
A common fixed-fractional approach risks 1% per trade; 0.5% is a more conservative alternative, while 2% carries greater exposure. The sequence of losses shows why percentage matters: after 10 consecutive losses at 0.5% risk, an example account retains 95.1% of its equity. At 2% risk, it retains 81.7%. These outcomes illustrate compounding, not a forecast for any single trade.
Fixed-percentage sizing can scale with account growth. As equity increases, the same percentage creates a larger cash-risk budget; as equity declines, the budget shrinks. Recalculate using current account size before each position rather than reusing an old cash amount. This keeps the formula aligned with your account, not with the original entry price or balance.
Choose the percentage before evaluating a trade’s potential profit, then keep it consistent across comparable setups. A fixed lot emphasizes quantity, fixed cash emphasizes dollars at risk, and fixed fractional emphasizes the percentage of equity. Use those distinctions to select a method that matches your risk plan, then open a trading account to put your approach into practice.
What Is Position Sizing?
Position sizing determines how many units a trade uses, based on risk and market conditions. It matters because an oversized position can turn a routine losing trade into a damaging account loss.
Sizing Across Trading Styles
Scalpers and swing traders size positions around different stop distances and trading rhythms. Futures scalpers may use stops of 5-15 ticks, while swing-trading examples place stops 2-5% from entry. A wider stop generally calls for fewer contracts or shares to keep planned risk aligned. Volatility matters too: high-volatility futures require smaller positions than quieter markets with comparable risk limits.
For each setup, calculate the loss per contract or share at the stop, then divide your risk budget by that amount. This connects the market’s movement to the amount you are prepared to lose. A short-duration trade does not automatically justify a larger position: spreads, slippage, and rapid price movements can affect the actual exit.
Sizing Long and Short Trades
For long and short trades, position size depends on the absolute distance between entry and stop. A protective stop for a long position is usually below entry; for a short position, it is usually above entry. The direction changes, but the calculation uses potential loss per unit, keeping the method consistent on either side of the market.
For instance, a USD 250 risk budget and a USD 5 stop distance produce 50 shares. The same calculation applies to a short trade with a USD 5 distance to its stop. Use the intended exit level, not the expected profit target, to calculate exposure. Shares, contracts, and fractional lots each represent different units, so confirm what the order quantity counts.
Oversizing increases the account impact of each losing trade and can narrow room for later setups. Five open positions risking 1% each in the same sector can behave like one 5% bet. A stop doesn’t guarantee the exit price during a gap, so the realized loss can exceed the planned amount. Keep position size tied to risk, not the maximum quantity margin permits.
Trade documentation helps reveal whether actual risk matches the plan. Record entry, stop, position size, planned loss, and outcome for every trade. After 30 days, compare planned and actual risk to spot recurring slippage or sizing errors. If actual risk exceeds planned risk by more than 20%, investigate the difference before repeating the same setup.
Review losing trades alongside profitable ones. The result alone does not show whether the size was appropriate; compare the initial stop, execution, and final loss. If you add to a position, keep total risk within the original plan. Reviewing your trade log this way can help you adjust exposure as volatility, stop placement, or account equity changes.
Kelly Criterion and fractional Kelly
The Kelly Criterion calculates a position fraction from a strategy’s win probability and average win-to-loss ratio. Its formula is ((B + 1) × P − 1) ÷ B, where B is the win/loss ratio and P is the winning probability. The result estimates a fraction of bankroll, not a guarantee of profit. It only supports sizing when the strategy has positive expectancy.
For example, a 55% win rate, 45% loss rate, and 2:1 reward-to-risk ratio produce a Kelly fraction of 32.5%. On a $10,000 account, that example equates to $3,250 risk per trade. This illustrates full Kelly’s force: a mathematical output can imply a large risk percentage, even when each trade includes a stop loss.
Fractional Kelly scales that result down. Half Kelly uses half the full fraction, or 16.25% in this example; Quarter Kelly uses one quarter. These approaches trade some theoretical growth for a smaller position and potentially less volatile results. They don’t remove losses, and the chosen fraction still needs to fit the trader’s tolerance for drawdowns.
The inputs matter. Changes in win probability or the average win-to-loss ratio affect the formula’s output, so a small sample or shifting strategy can produce a misleading risk percentage. Kelly cannot turn an unprofitable strategy into a profitable one. Treat its result as dependent on measured performance, not as a fixed percentage for every market or setup.
To translate a Kelly fraction into a fractional-lot order, first define the cash amount at risk, then divide it by the loss per lot at the stop. Stop distance and pip value determine that loss. Round the resulting quantity down to the available lot increment. Margin is a separate constraint: it affects whether you can hold the position, but does not reduce the planned loss at the stop.
Review the inputs and actual outcomes as your strategy develops. Compare expected wins and losses with recorded trades, and recalculate if either changes. Kelly-based sizing can still lead to drawdowns that feel too large, especially when losses cluster. If the full result exceeds the risk per trade you can tolerate, use a smaller fraction or another sizing method instead of forcing the formula’s output.
Fractional-lot steps and rounding down
A calculated position size may fall between the lot increments your order accepts. The rule is simple: round down to the nearest permitted increment, then recalculate planned risk using that executable size. Rounding up can exceed the cash limit set before the trade.
For example, an unrounded calculation of 0.3333 lots becomes 0.33 lots when rounded down to a 0.01 step. The illustrative calculator shows a risk of 99.00 account-currency units at that size. Compare that actual amount with your risk budget before placing the order, since rounding changes exposure.
A larger increment can create a bigger gap between calculated and tradable size. An illustrative 0.47-lot position rounded down to a 0.10-lot step becomes 0.40 lots, with a USD 80 planned loss. The difference comes from the step, not a change in the stop or market volatility. Recalculate the cash risk after rounding rather than assuming the original result still applies.
Minimums matter too. If a calculation gives 0.005 lots but the minimum is 0.01 lots, entering the minimum can increase risk. In the example, 0.01 lots would imply a USD 2 loss at the stop. If that exceeds the chosen budget, skip the trade or adjust the setup; don’t automatically round up just to enter.
A micro lot is 0.01 lots in the illustrative lot convention, but order increments and minimums can differ across instruments and trading platforms. For a USD 1,000 account risking 0.5%, the planned loss is USD 5. If the smallest permitted size risks more than USD 5 at the chosen stop, the trade doesn’t fit that risk limit as calculated.
Use the same sequence with each sizing method: calculate risk from capital and stop distance, convert that budget into lots, round down, then check the resulting risk and required margin. You may need a smaller position when volatility widens the stop. Rounding down can leave part of your risk budget unused, but that is better than exceeding it without realizing.
Record both the unrounded calculation and the final order size. For example, log 0.3333 lots, 0.33 lots entered, and 99.00 units of planned risk. Reviewing those figures across trades helps identify whether lot steps materially affect your method. Open an account to apply your sizing approach.
TradingPRO: Social Trading / Copy Trading
TradingPRO’s Social Trading and Copy Trading ecosystem lets traders replicate the strategies of successful market participants. It may suit those who want to follow another trader’s approach while still considering position size, stop distance, and risk per trade. Copying a strategy does not remove market risk or replace a personal risk plan.
For a more hands-on approach, TradingPRO offers Rookie, Micro, and Pro accounts for different trading needs. Choose an account that suits your preferred style and the approach you are prepared to manage. Keep your sizing rules consistent, and include every copied or self-directed position in your overall risk calculation.
Contact TradingPRO to discuss Social Trading / Copy Trading or account options.
Make Your Risk Plan Work Across Trades
Sound execution starts before an order reaches the market. Turn your position sizing rules for fractional lots into a consistent decision process, and review that process whenever your strategy, trading style, or risk tolerance changes. The aim is not to force every setup into the same shape, but to make each position deliberate and keep your decisions aligned with a plan you can follow.
Put that discipline into practice on your next trade. Define what would invalidate the setup, decide how much exposure fits your approach, and record your reasoning. Over time, your trade log can help you see whether your sizing choices remain consistent as market conditions change.
Take your next step with TradingPRO and build a trading approach grounded in clear decisions. Stay focused, keep refining your process, and move forward with purpose.
Frequently Asked Questions
How do you calculate position size in forex?
Divide your cash risk limit by the stop-loss distance multiplied by pip value per lot. For example, a USD 100 risk budget, 20-pip stop, and USD 10 pip value per 1.00 lot produce a 0.50-lot position. Convert pip value into your account currency when it differs from the pair’s quote currency. Then account for the platform’s lot increment before placing the order.
How Do You Size Positions at Different Account Sizes?
Apply the same risk percentage to each account’s current equity, then calculate a position using that cash amount and the trade’s stop distance. At a 1% risk rate, a USD 9,000 account has a USD 90 budget; a USD 25,000 account has a USD 250 budget. The resulting lot size can still differ because the stop and instrument value also affect risk.
How Do You Verify Your Actual Risk Matches Your Plan?
Compare the intended entry and stop with the executed prices and final position quantity. Include spread, commissions, and slippage in the realized result, then record the planned and actual risk together. Review the comparison after 30 days. If actual risk exceeds planned risk by more than 20%, investigate whether execution costs, a changed stop, or a sizing error caused the gap.
How should lot-step rounding and minimum volume be handled?
Round a calculated lot size down to the nearest permitted increment, then recalculate its stop-loss exposure. Do not round up automatically to meet a minimum volume: the larger order may exceed your risk budget. If the smallest available position risks more than you intend, the trade does not fit your plan. A smaller lot increment can help you use your risk budget more precisely.
Should I adjust position size for different strategies?
Yes. Keep your risk framework consistent, but adjust position size to each strategy’s stop distance and market volatility. A swing setup with a wider structural stop generally needs fewer units than a tighter-stop setup with the same cash-risk limit. For scalping, spreads and execution costs can have a greater effect when the stop is tight. A change in strategy calls for a fresh size calculation.
What about different risk levels?
A lower risk percentage creates a smaller cash budget and usually a smaller position; a higher percentage increases both exposure and potential loss. For example, 0.5% is described as a very conservative approach, while 2% is an aggressive one. Choose a level you can apply consistently through losing trades, and include the combined exposure of simultaneous positions in your plan.
When Should You Use the 1% Rule vs the 2% Rule?
The 1% rule sets a smaller risk budget than 2% for the same account equity, so it limits each planned loss more tightly. Treat 2% as a more aggressive choice, not an automatic upgrade. Consider it only after at least 50 trades show positive expectancy and other performance conditions are met. The strategy’s results and your tolerance for drawdowns matter.
How do you calculate position size using a fixed percentage of account equity?
Multiply current account equity by the chosen percentage to find the cash risk budget. Then divide that budget by the loss per unit at the stop. For instance, 1% of a USD 30,000 account is USD 300; the number of shares or lots depends on the stop distance and unit value. Recalculate after equity changes, rather than carrying forward an old cash amount.


