




- Published on: 2026-09-02 10:13:00
A Beginner’s Guide to Reading Candlestick Charts
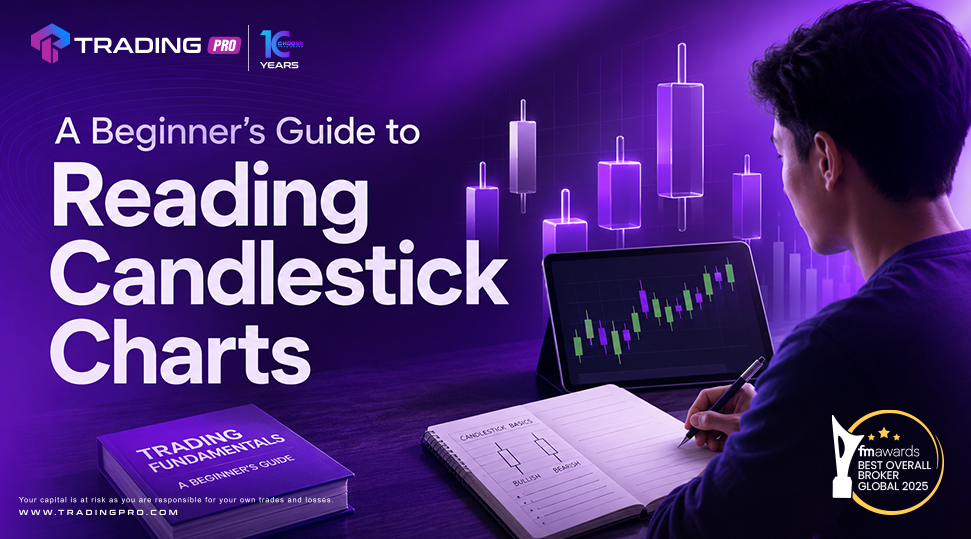
Charts are one of the most common tools used in technical analysis. Among the different chart types available, candlestick charts are widely used because they provide several pieces of price information within a single visual element.
For traders in the MENA region, learning how to read candlestick charts can be a useful first step toward understanding price action and developing basic technical analysis skills.
Candlesticks can help traders see how prices moved during a specific period, but they should be interpreted as part of a broader analysis rather than as guaranteed signals.
What Is a Candlestick?
A candlestick represents price movement during a specific period.
Depending on the selected timeframe, one candle could represent a minute, an hour, a day, or another period.
Each candle generally provides four key pieces of information:
-
Opening price
-
Closing price
-
Highest price
-
Lowest price
Together, these values provide a visual summary of what happened during that period.
Understanding the Parts of a Candlestick
A typical candlestick contains a body and one or two wicks.
The Candle Body
The body represents the difference between the opening and closing prices.
If the closing price is above the opening price, the candle generally represents upward price movement.
If the closing price is below the opening price, it generally represents downward movement.
The Wicks
The wicks, also known as shadows, show the highest and lowest prices reached during the period.
A long upper wick can indicate that prices moved higher but later pulled back.
A long lower wick can show that prices moved lower before recovering.
These observations can provide useful information about price behavior.
Bullish and Bearish Candles
Candlesticks are often described as bullish or bearish depending on the relationship between opening and closing prices.
Bullish Candles
A bullish candle closes above its opening price.
It can indicate that buyers were stronger during that particular period.
However, one bullish candle does not automatically mean that an upward trend will continue.
Bearish Candles
A bearish candle closes below its opening price.
It can indicate stronger selling pressure during that period.
As with bullish candles, the broader market context remains important.
Common Candlestick Patterns
Some combinations of candles are commonly studied by technical traders.
Doji Candles
A doji occurs when the opening and closing prices are relatively close together.
It can indicate uncertainty or a balance between buying and selling pressure.
Its significance depends on where it appears within the broader price structure.
Hammer Pattern
A hammer typically has a relatively small body and a longer lower wick.
It can appear after a decline and may attract attention from traders looking for signs of a potential change in momentum.
However, confirmation from subsequent price action is important.
Engulfing Patterns
An engulfing pattern involves one candle’s body substantially covering the previous candle’s body.
Bullish and bearish versions can provide traders with information about changing buying or selling pressure.
Again, the pattern should be considered alongside the broader market environment.
Why Context Matters
Candlestick patterns do not have the same meaning in every situation.
Consider Support and Resistance
A candlestick pattern near an important support or resistance area may provide different information from the same pattern appearing in the middle of a strong trend.
Combining price action with established technical levels can therefore provide additional context.
Consider the Market Trend
The broader trend can also influence how traders interpret individual candles.
A single bearish candle during a strong upward trend may not necessarily signal a complete reversal.
This is why traders should avoid making decisions based on one candle alone.
Candlestick Charts for MENA Traders
MENA traders may use candlestick charts when analyzing forex, commodities, indices, and other financial instruments.
The same basic chart principles can be applied across different markets, although each market has its own characteristics.
Oil markets, for example, can experience price movements in response to global supply, demand, economic data, and geopolitical developments.
Understanding the broader market environment can therefore complement candlestick analysis.
Building Basic Chart-Reading Skills
Beginners can improve their chart-reading skills by practicing a simple process.
Start With the Bigger Picture
Before focusing on individual candles, identify the broader market direction and important price levels.
Study Price Behavior
Observe how price reacts around support, resistance, and previous highs or lows.
Practice Consistently
Reviewing historical charts can help traders become more familiar with different candlestick formations and market conditions.
Practice should focus on understanding rather than trying to memorize every available pattern.
How TradingPRO Can Support Technical Learning
TradingPRO provides trading tools and educational resources that can help traders develop their understanding of technical analysis.
For MENA traders, combining candlestick analysis with other technical tools, market research, and responsible risk management can support a more structured approach to analyzing financial markets.
Conclusion
Candlestick charts provide traders with a simple visual way to understand price movement, including opening, closing, high, and low prices.
For beginners in the MENA region, learning how to read candlesticks can provide a useful foundation for developing technical analysis skills.
The key is to avoid treating individual candlestick patterns as guaranteed predictions. Instead, traders can use them alongside market trends, support and resistance, broader research, and risk management to develop a more informed view of market conditions.
Start Your Trading Journey with TradingPRO
Ready to take the next step in your trading journey? Visit TradingPRO to register your account and connect with TradingPRO across our social media channels.


